Overview
As personal data becomes an increasingly prevalent part of our daily routines, we have a growing need to understand and derive meaningful actions from it. In response, the interdisciplinary project Grow Active aims to explore the potential of data physicalizations - physical artifacts that encode data - to support people's understanding of personal data and enable informed action.
Problem:
Physical activity is essential to our health. However, most people working from home struggle to be active enough for various reasons. Since there is little direct daily feedback, staying motivated and continuously active is hard. Moreover, there is a general lack of knowledge about the right amount of activity. And sometimes, one simply forgets to engage in physical activity. As a result, physical inactivity increases the risk of suffering from heart disease in the long term or of developing other risk factors, such as high blood pressure or obesity.
Physical activity is essential to our health. However, most people working from home struggle to be active enough for various reasons. Since there is little direct daily feedback, staying motivated and continuously active is hard. Moreover, there is a general lack of knowledge about the right amount of activity. And sometimes, one simply forgets to engage in physical activity. As a result, physical inactivity increases the risk of suffering from heart disease in the long term or of developing other risk factors, such as high blood pressure or obesity.
Role:
Research, digital & physical product design
Research, digital & physical product design
Tools:
Figma, 3D-Print, Fusion 360, Photoshop, Illustrator, Camera, After Effects
Figma, 3D-Print, Fusion 360, Photoshop, Illustrator, Camera, After Effects
Methods:
Research through Design, User Research, Design Thinking, Physical & Digital Prototyping
Research through Design, User Research, Design Thinking, Physical & Digital Prototyping
Solution
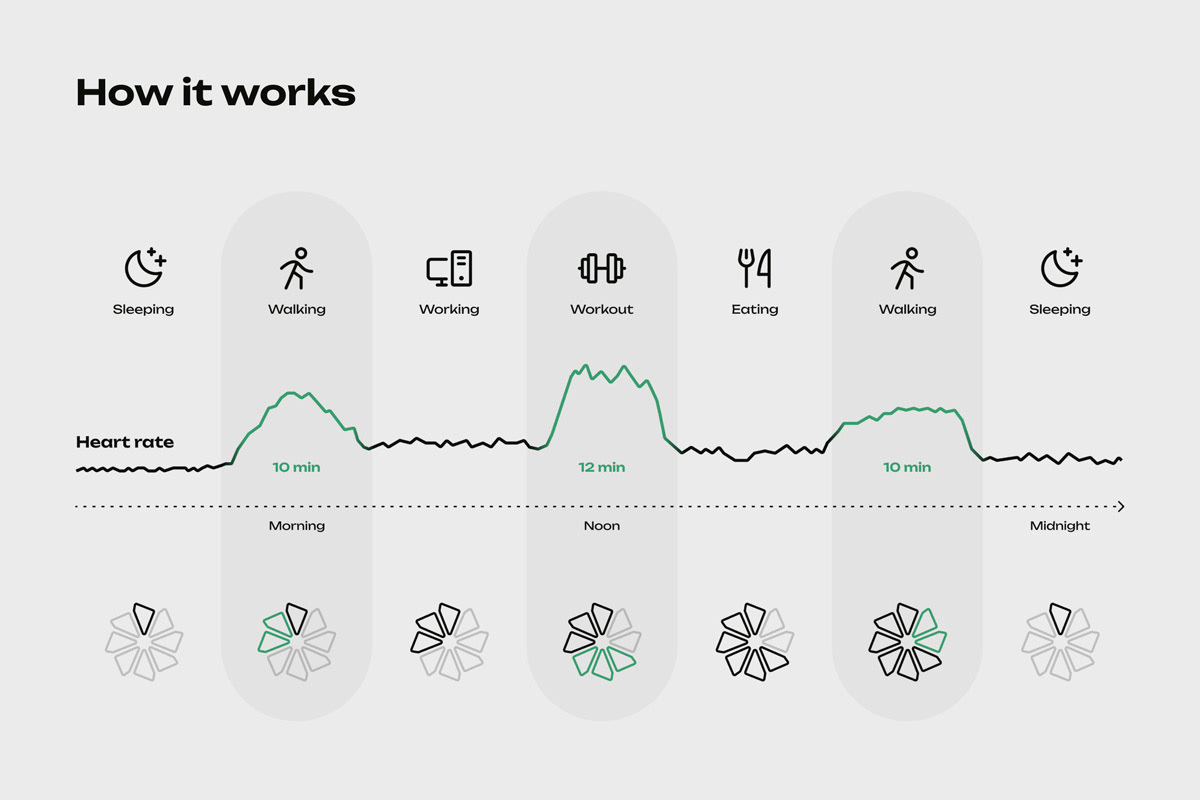
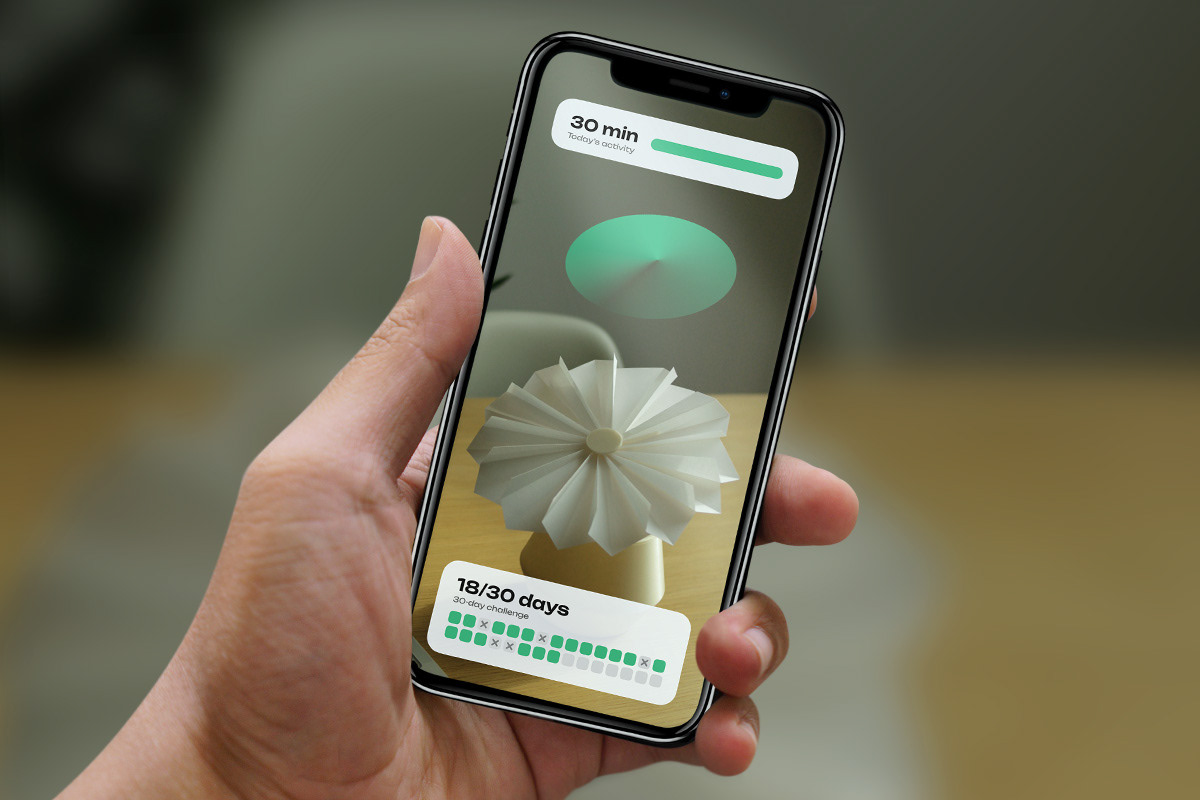
Grow Active helps you build a healthy, active lifestyle routine. Inspired by indoor plants, which only grow when taken care of, the mechanical plant leaf slowly opens when the user engages in physical activity. The user's smartwatch tracks their time in an activity-indicating heart rate zone and sends this data to the plant. It takes 30 min of activity to open the leaf completely, following the Harvard School of Public Health’s recommendation for an optimal amount of daily activity. Furthermore, Grow Active helps you to establish your new routine of daily activity through frequent repetition. With an AR application, you can view more detailed information and engage in a 30-day challenge to stay on track. Your performance is visualized through a colored heat map on top of the leaf within the AR.
Grow Active is a constant reminder in your home, allowing you to read your daily activity status intuitively. In addition, the flourishing plant serves as a physical representation of your self-care and engagement in an active lifestyle to promote your health.
Grow Active is a constant reminder in your home, allowing you to read your daily activity status intuitively. In addition, the flourishing plant serves as a physical representation of your self-care and engagement in an active lifestyle to promote your health.
Process
Over a semester, I collaboratively work with two computer science students, Tobias Sandmann & Firas Drass, on Grow Active.
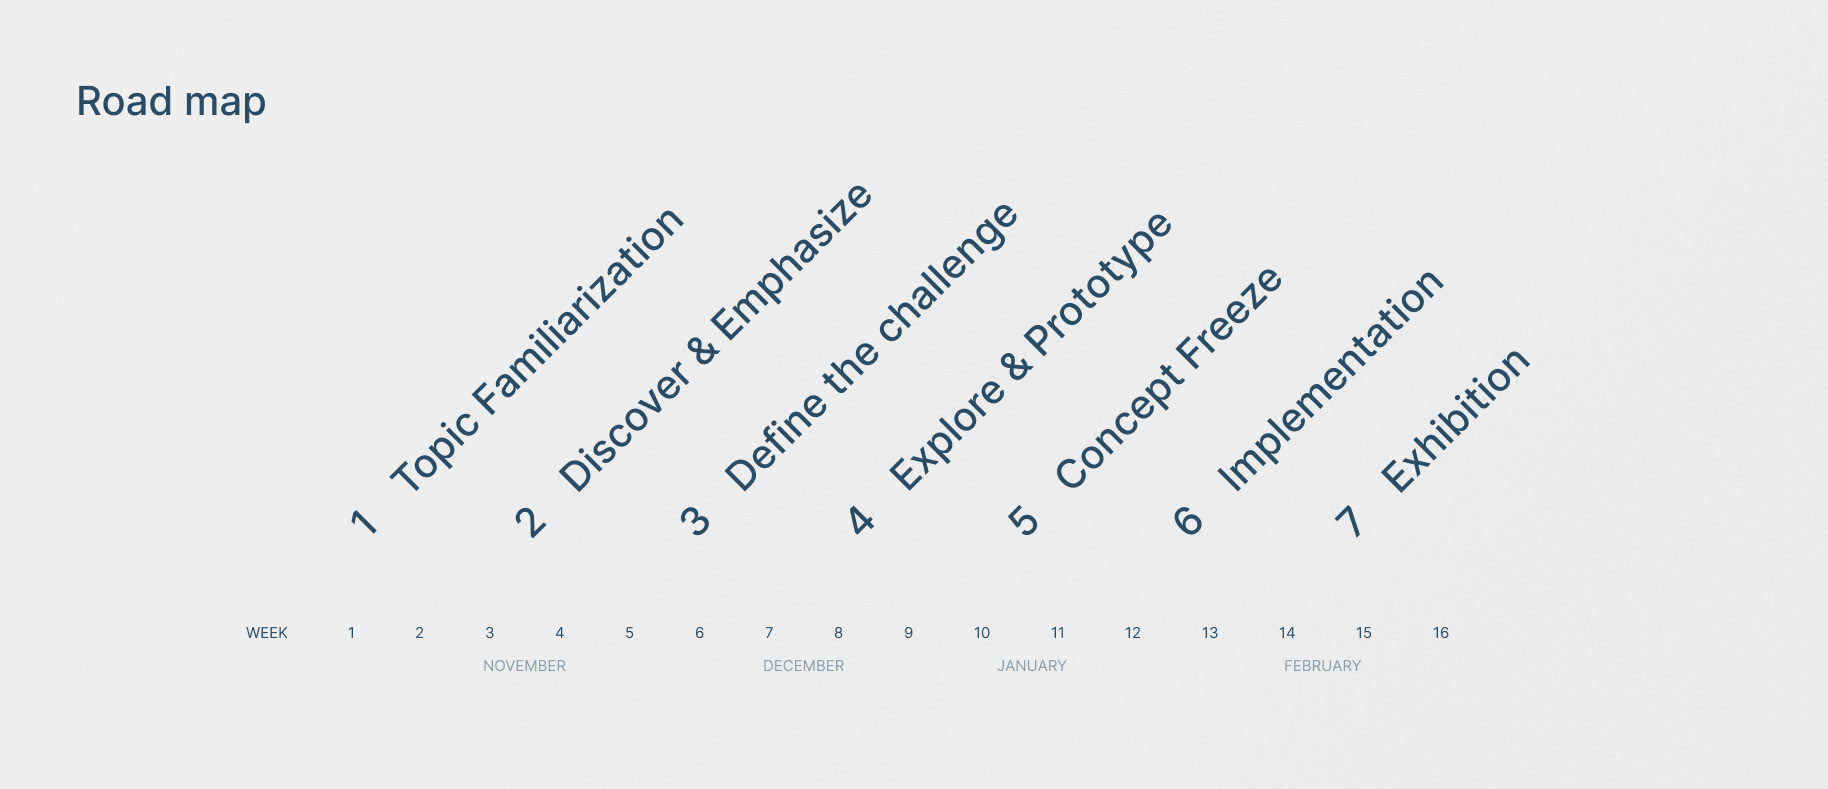
The phases and schedule of our project work
Topic Familiarization
We kicked off the project by immersing ourselves in the topic of data physicalization. By studying other projects and doing small experiments and exercises, we discovered the benefits of data physicalization.
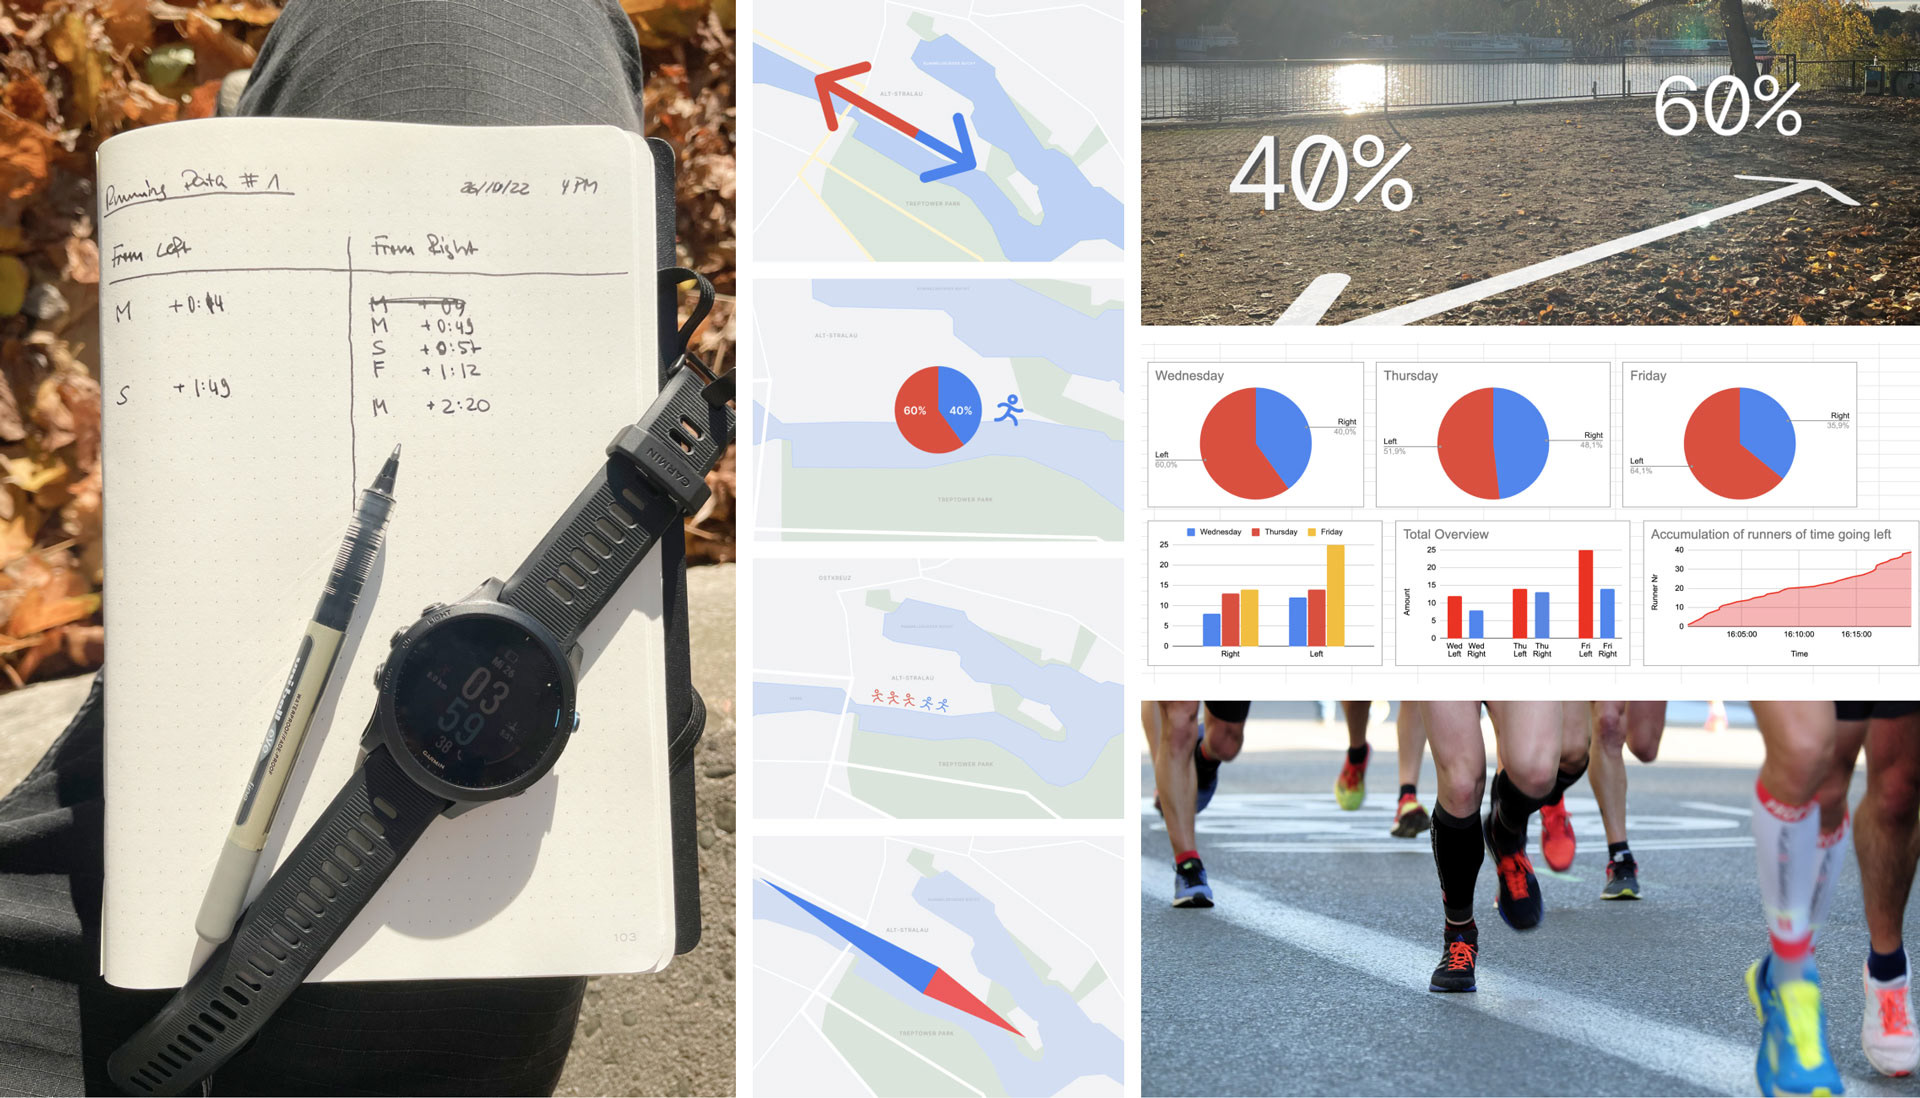
I practiced gathering data, cleaning and arranging it, and created different visualizations
Emphasize
Out of personal interest, we decided to go in the direction of sport and health. We researched relevant data types in these fields and interviewed friends about their dealings with sports, health, and data. Thereby, we identified a series of problems and challenges. We also learned that, according to the Havard School of Public Health, already 20–30 min of activity is the optimal amount to remain healthy. Furthermore, every activity that increases my heart rate above the resting rate counts for that.
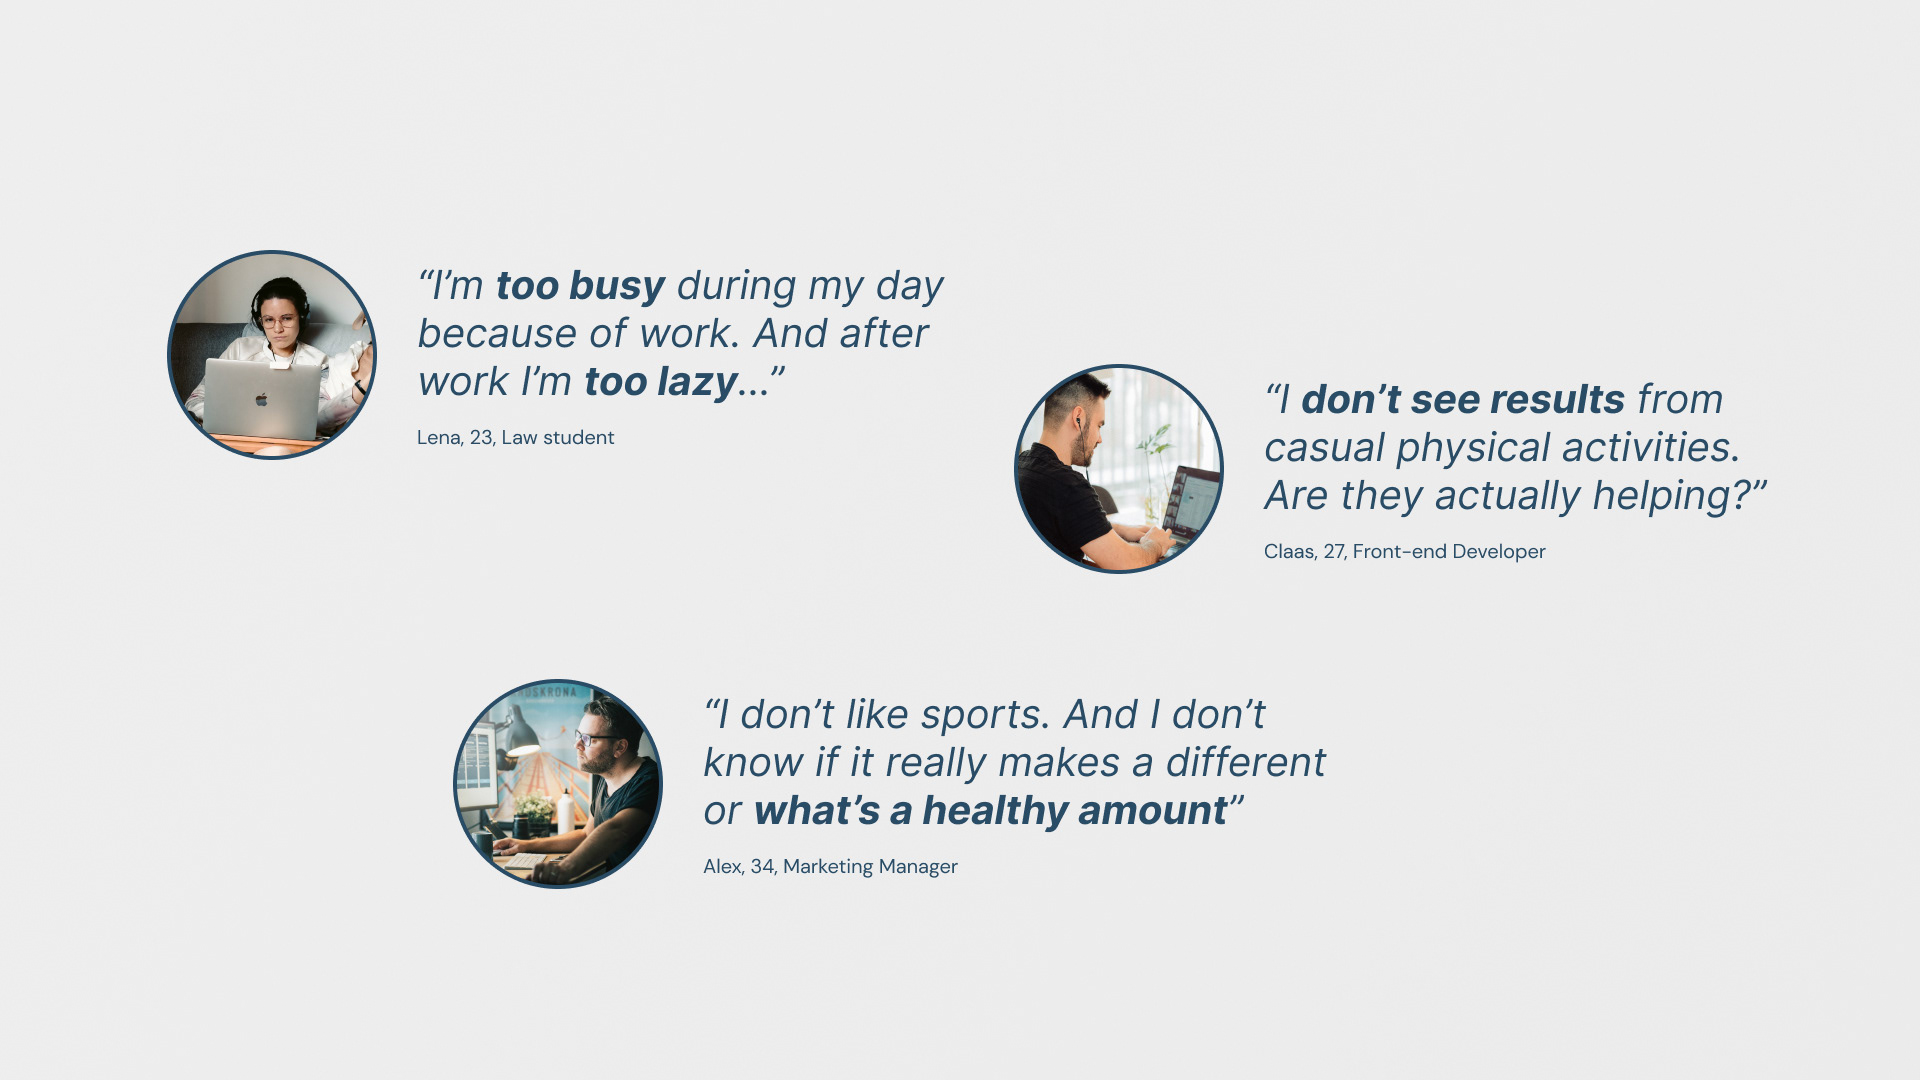
Key takeaways from interview
Define the challenge
Inspired by our learning from the interviews and research, we defined an overall challenge we wanted to address in that project: How might we help people working from home establish the routine of doing 30 min physical activities daily?
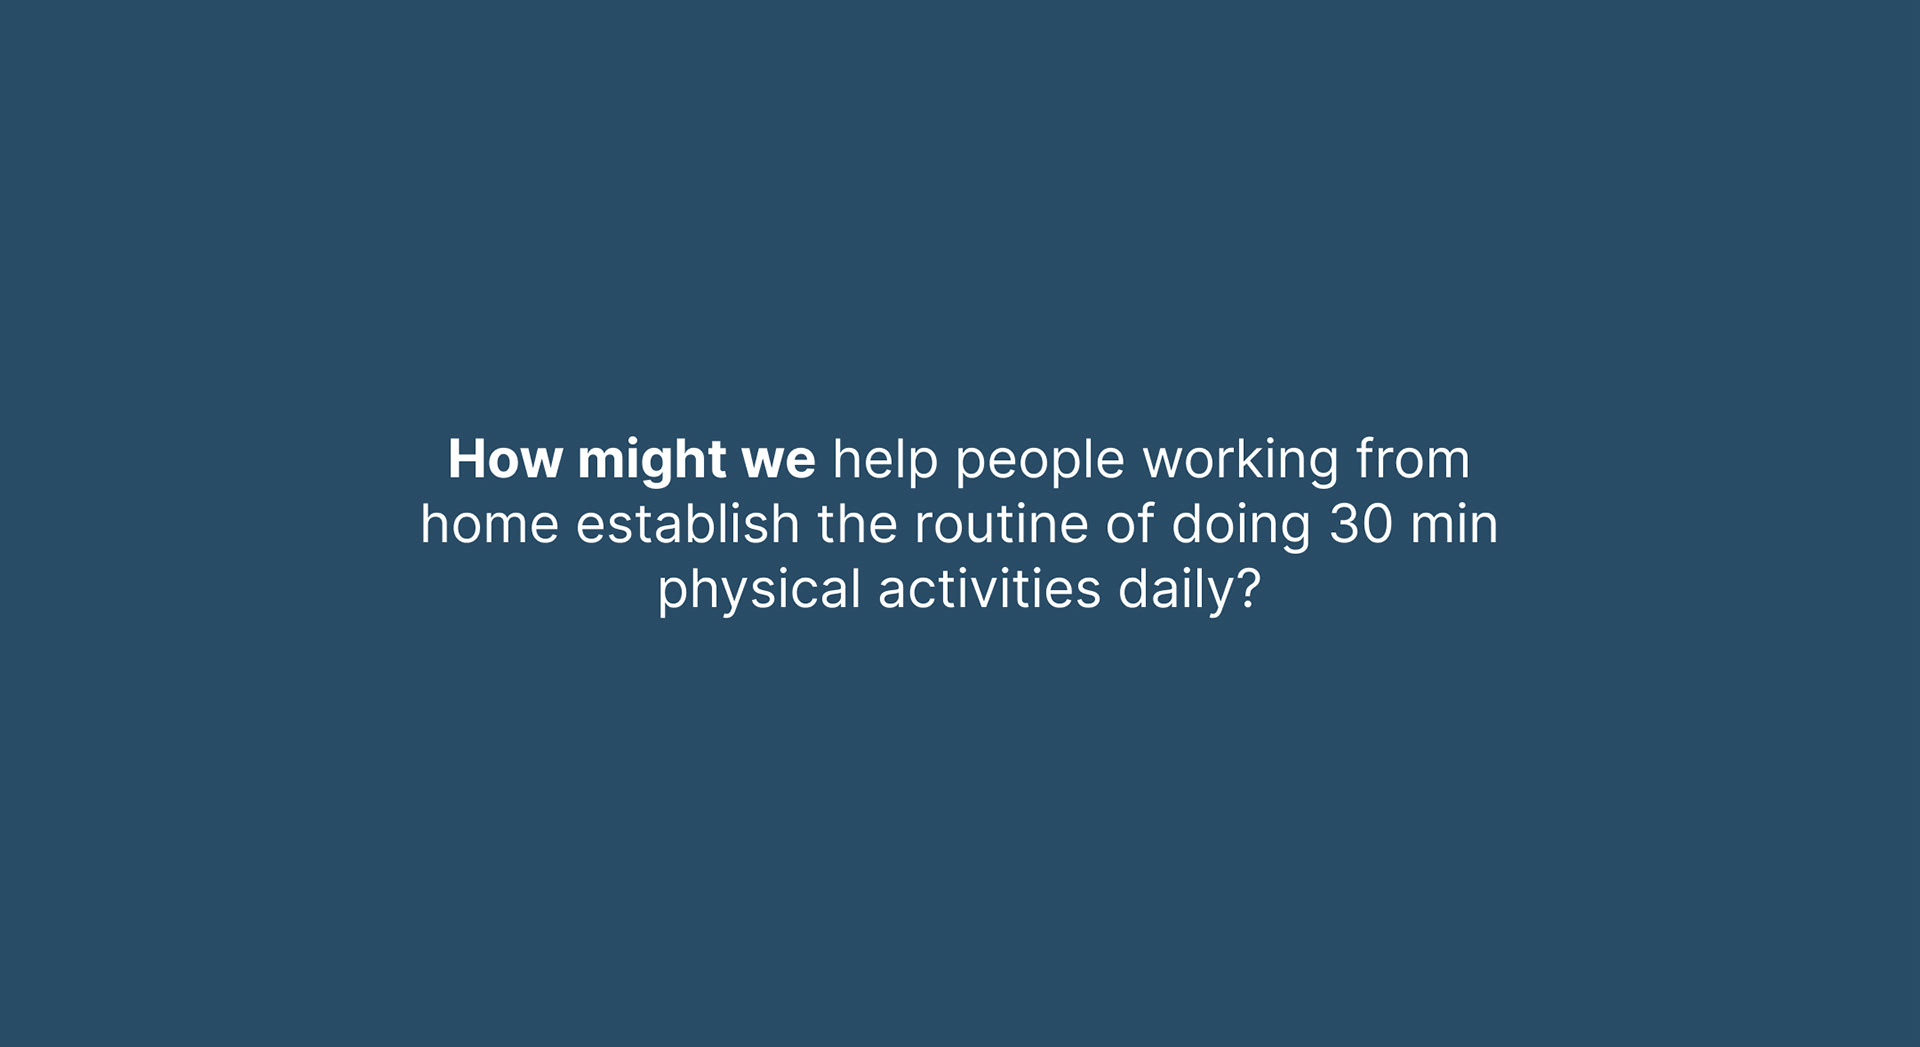
Our overall project challenge
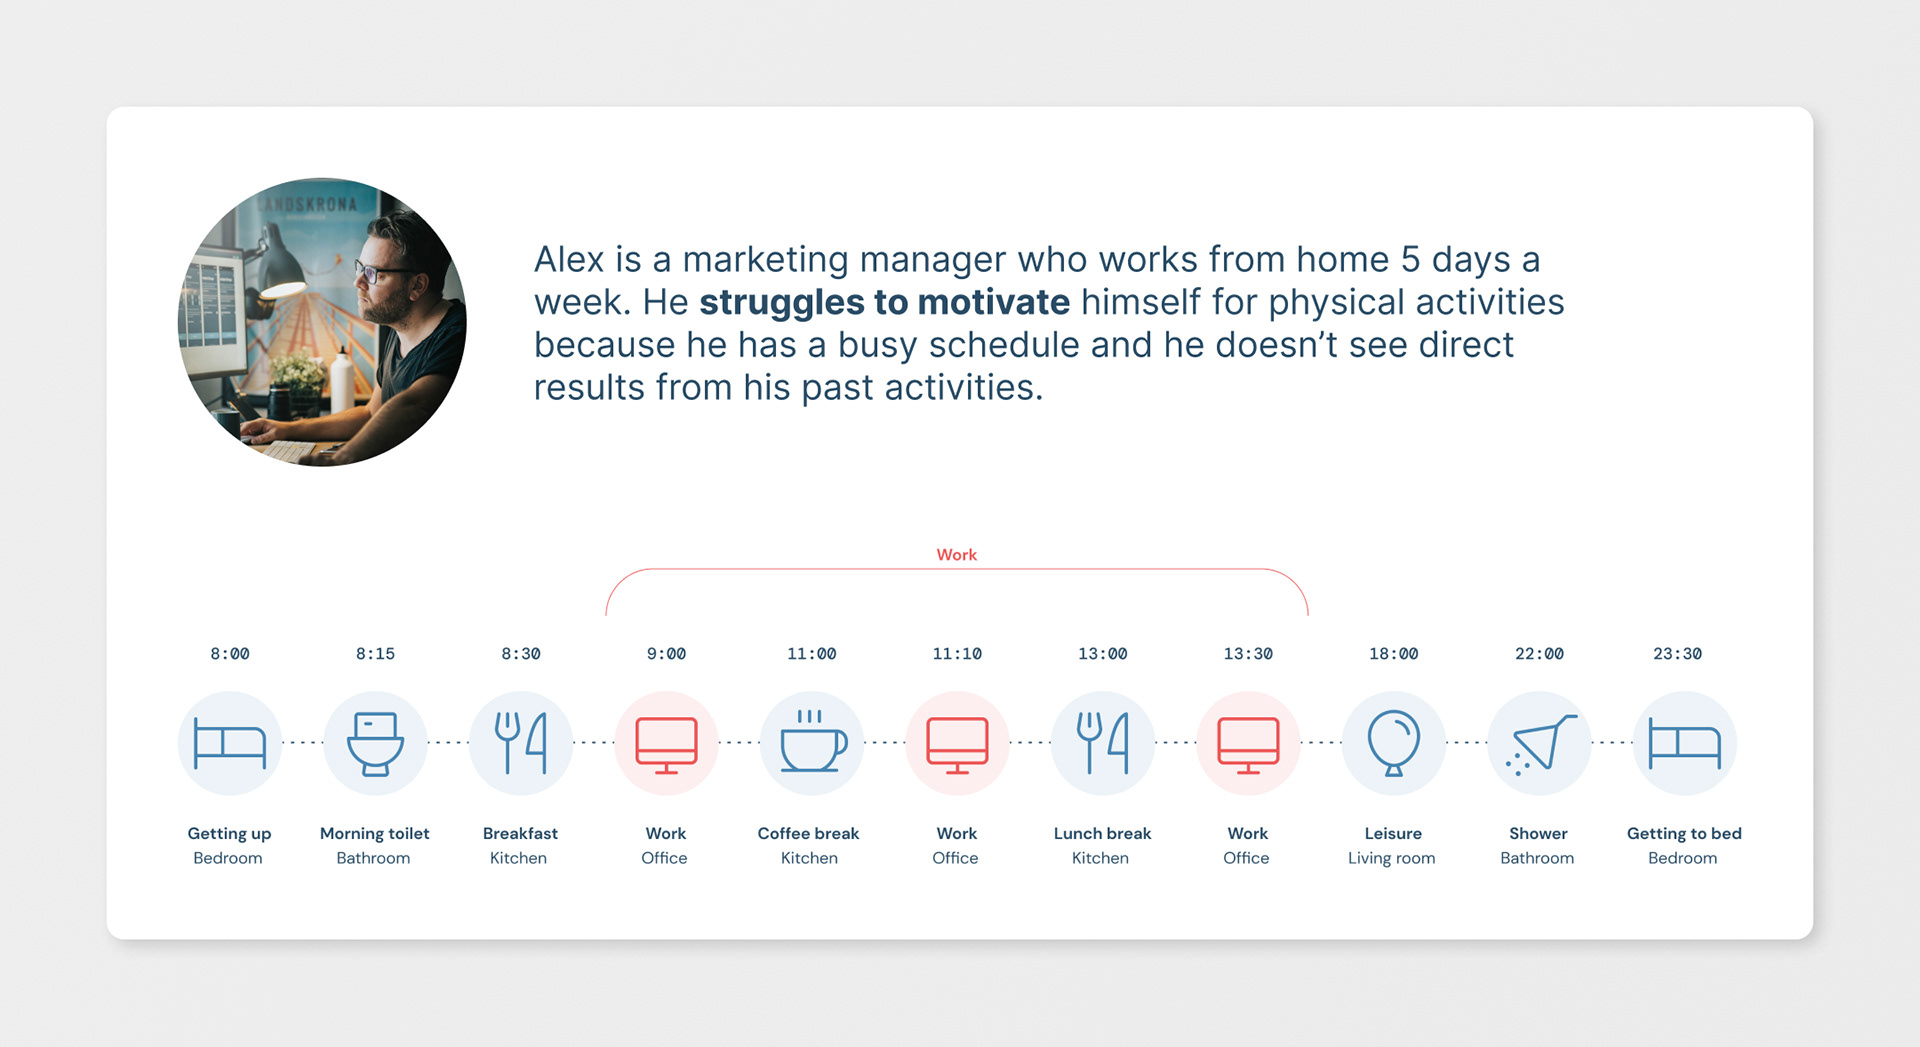
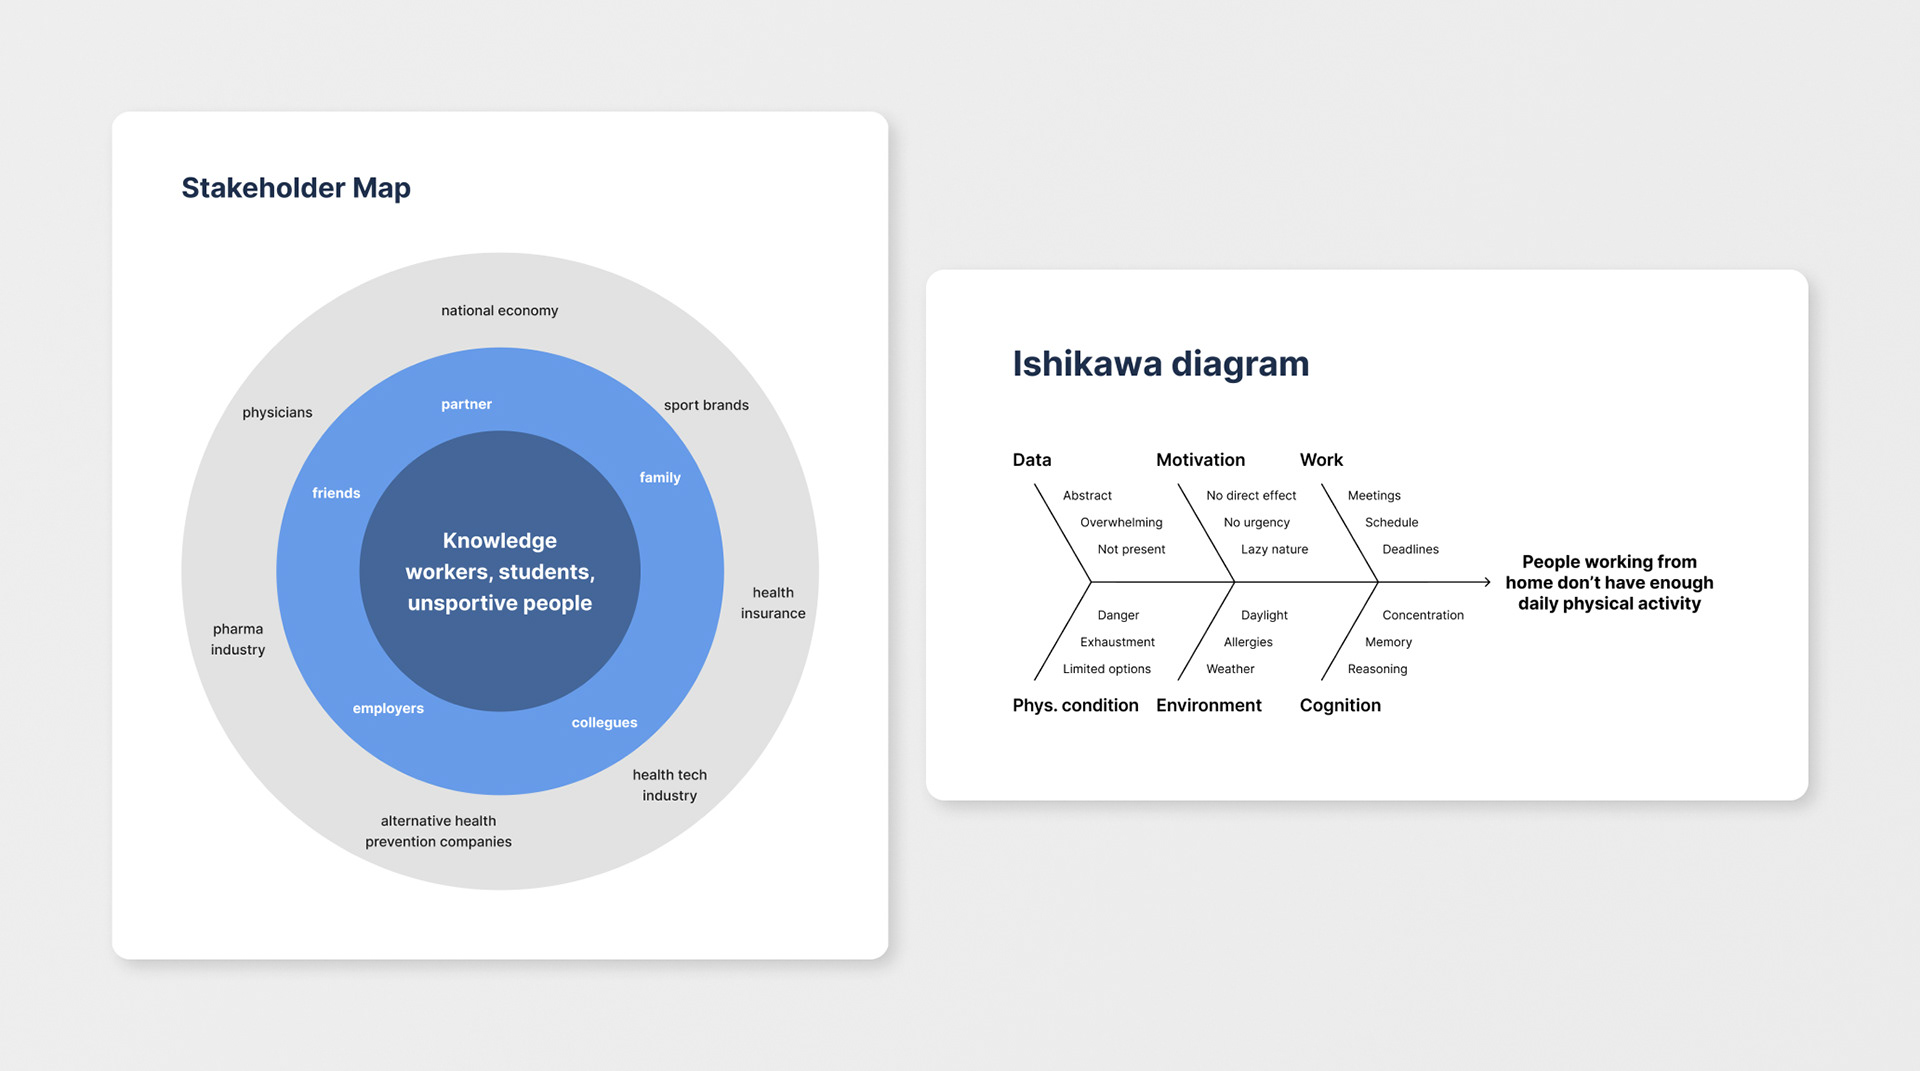
To emphasize better with our target group, we ask our previous interviewees to track their daily routines when working from home. We also created a stakeholder map and a fishbone diagram to develop an in-depth understanding of the problem area.
We concluded that the following aspects should define our further design process: Our product should be something for the home environment. It should be a calm, ambient interface that doesn't distract from work. It should be easy to read and trigger its user on an emotional level.
Exploration & Prototypes
We started creating several lo-fi prototypes of ideas to test how our target group would respond to them and how feasible they would be. The idea of using a plant and its condition as an interface stuck with us from the start. It triggered us emotionally and was intuitive to read.
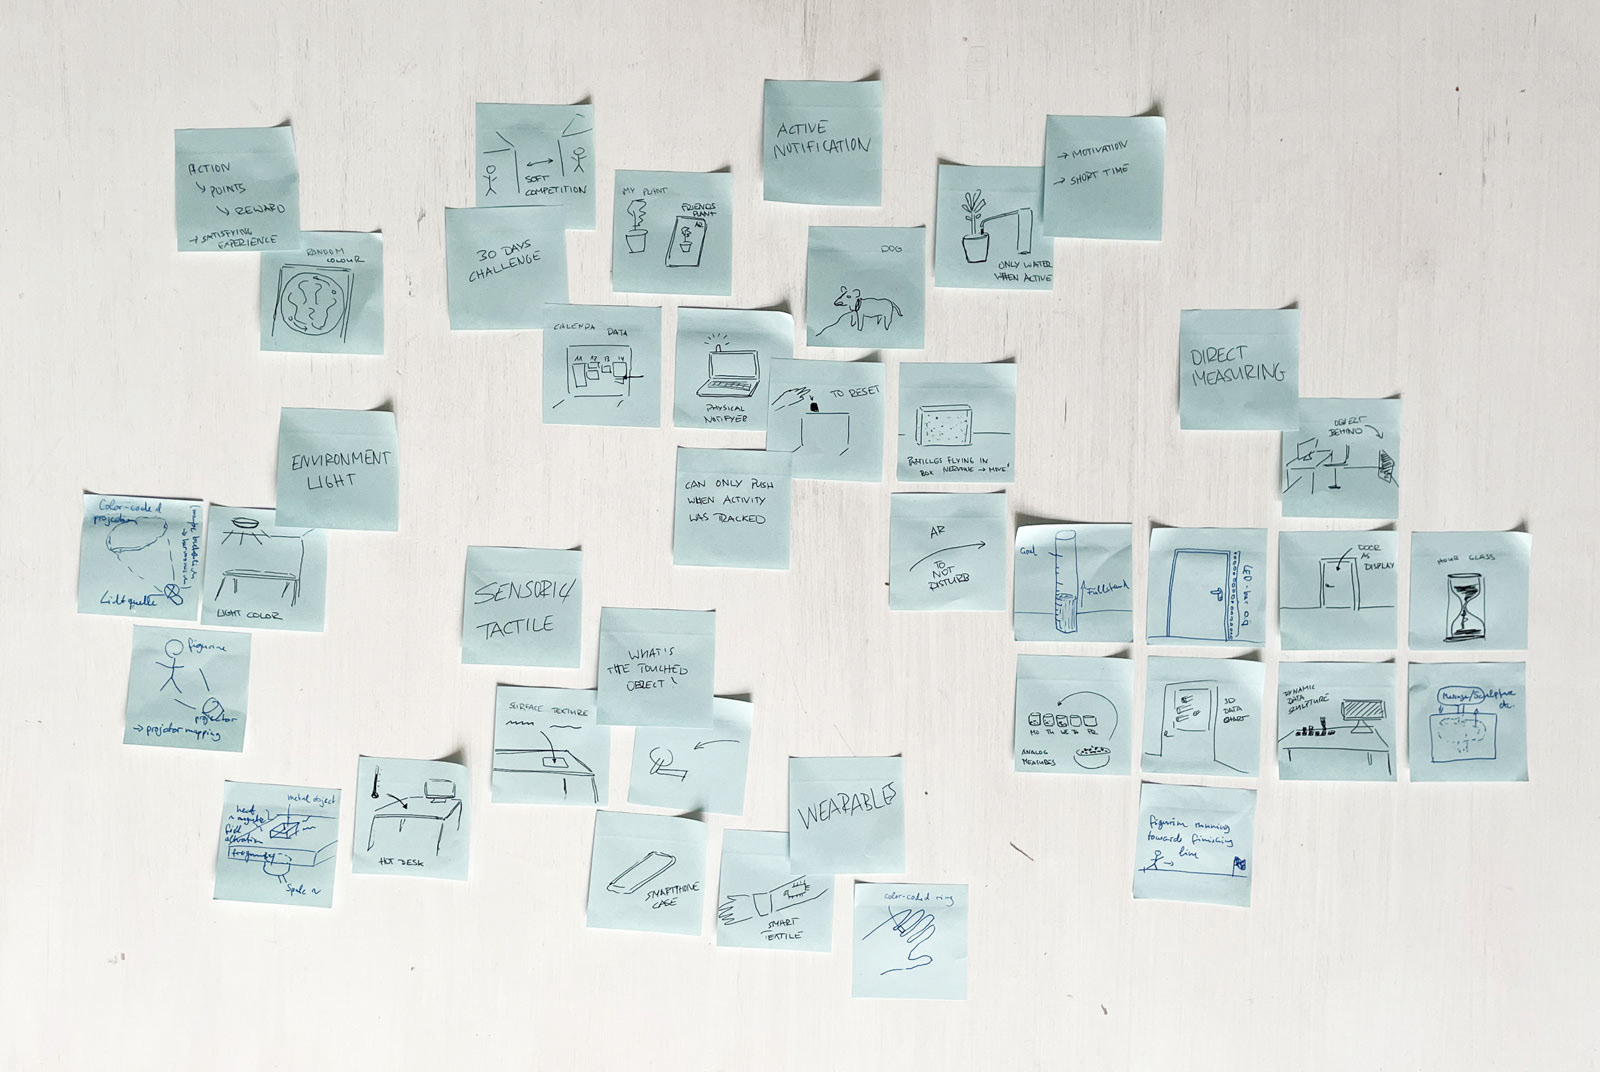
Results from an early brainstorming session
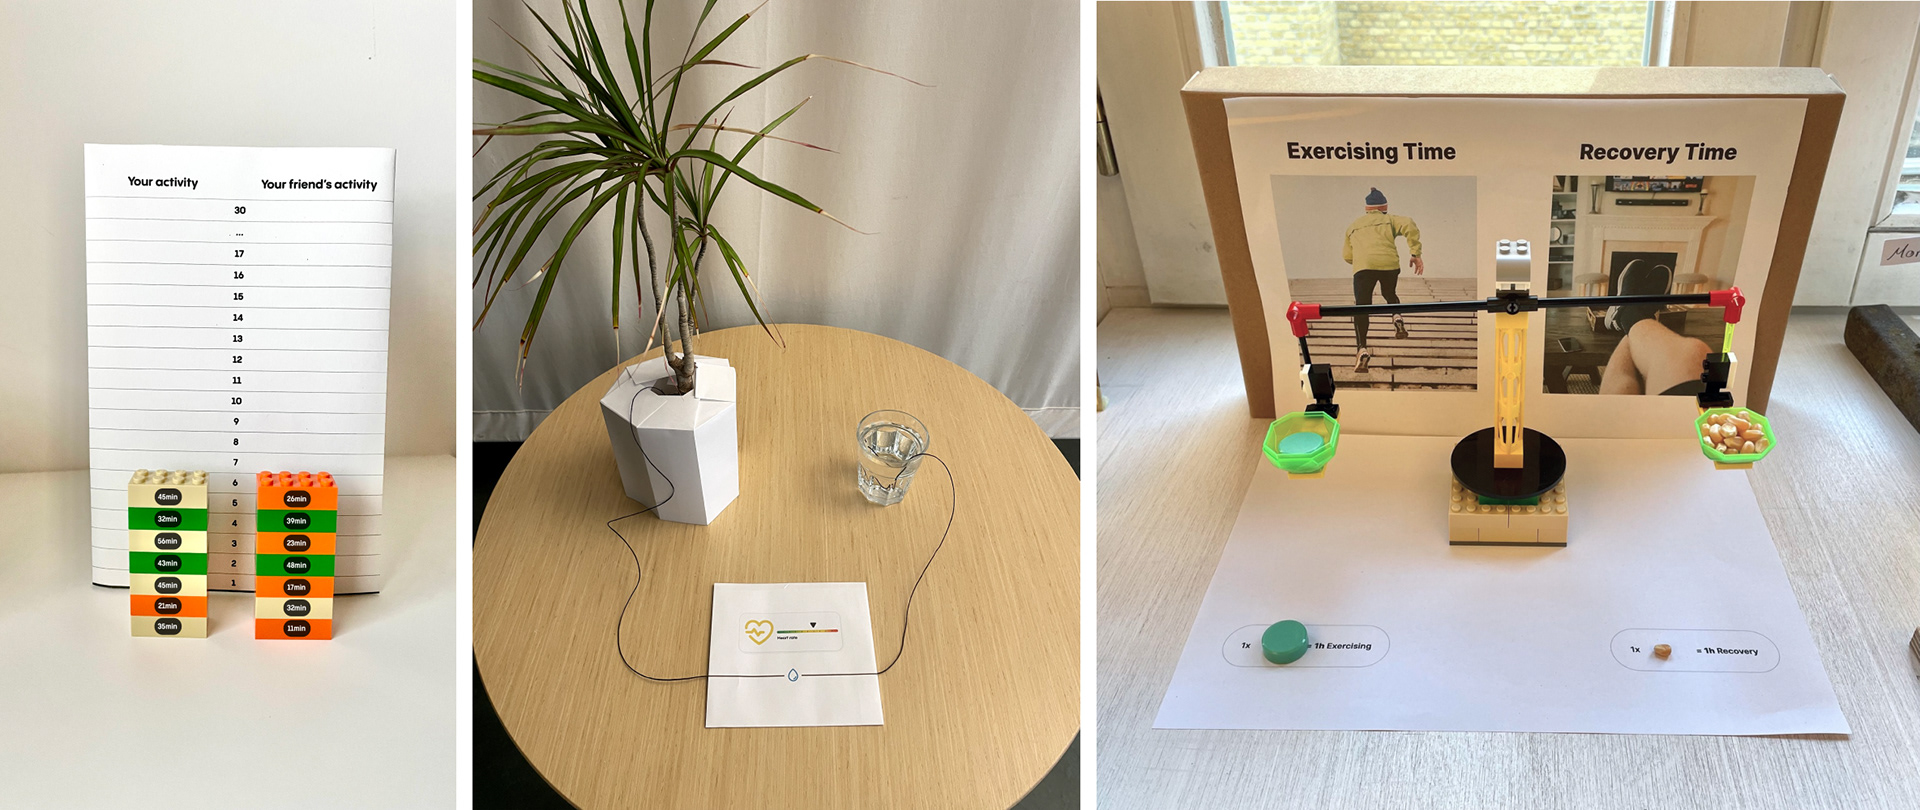
Our first prototypes
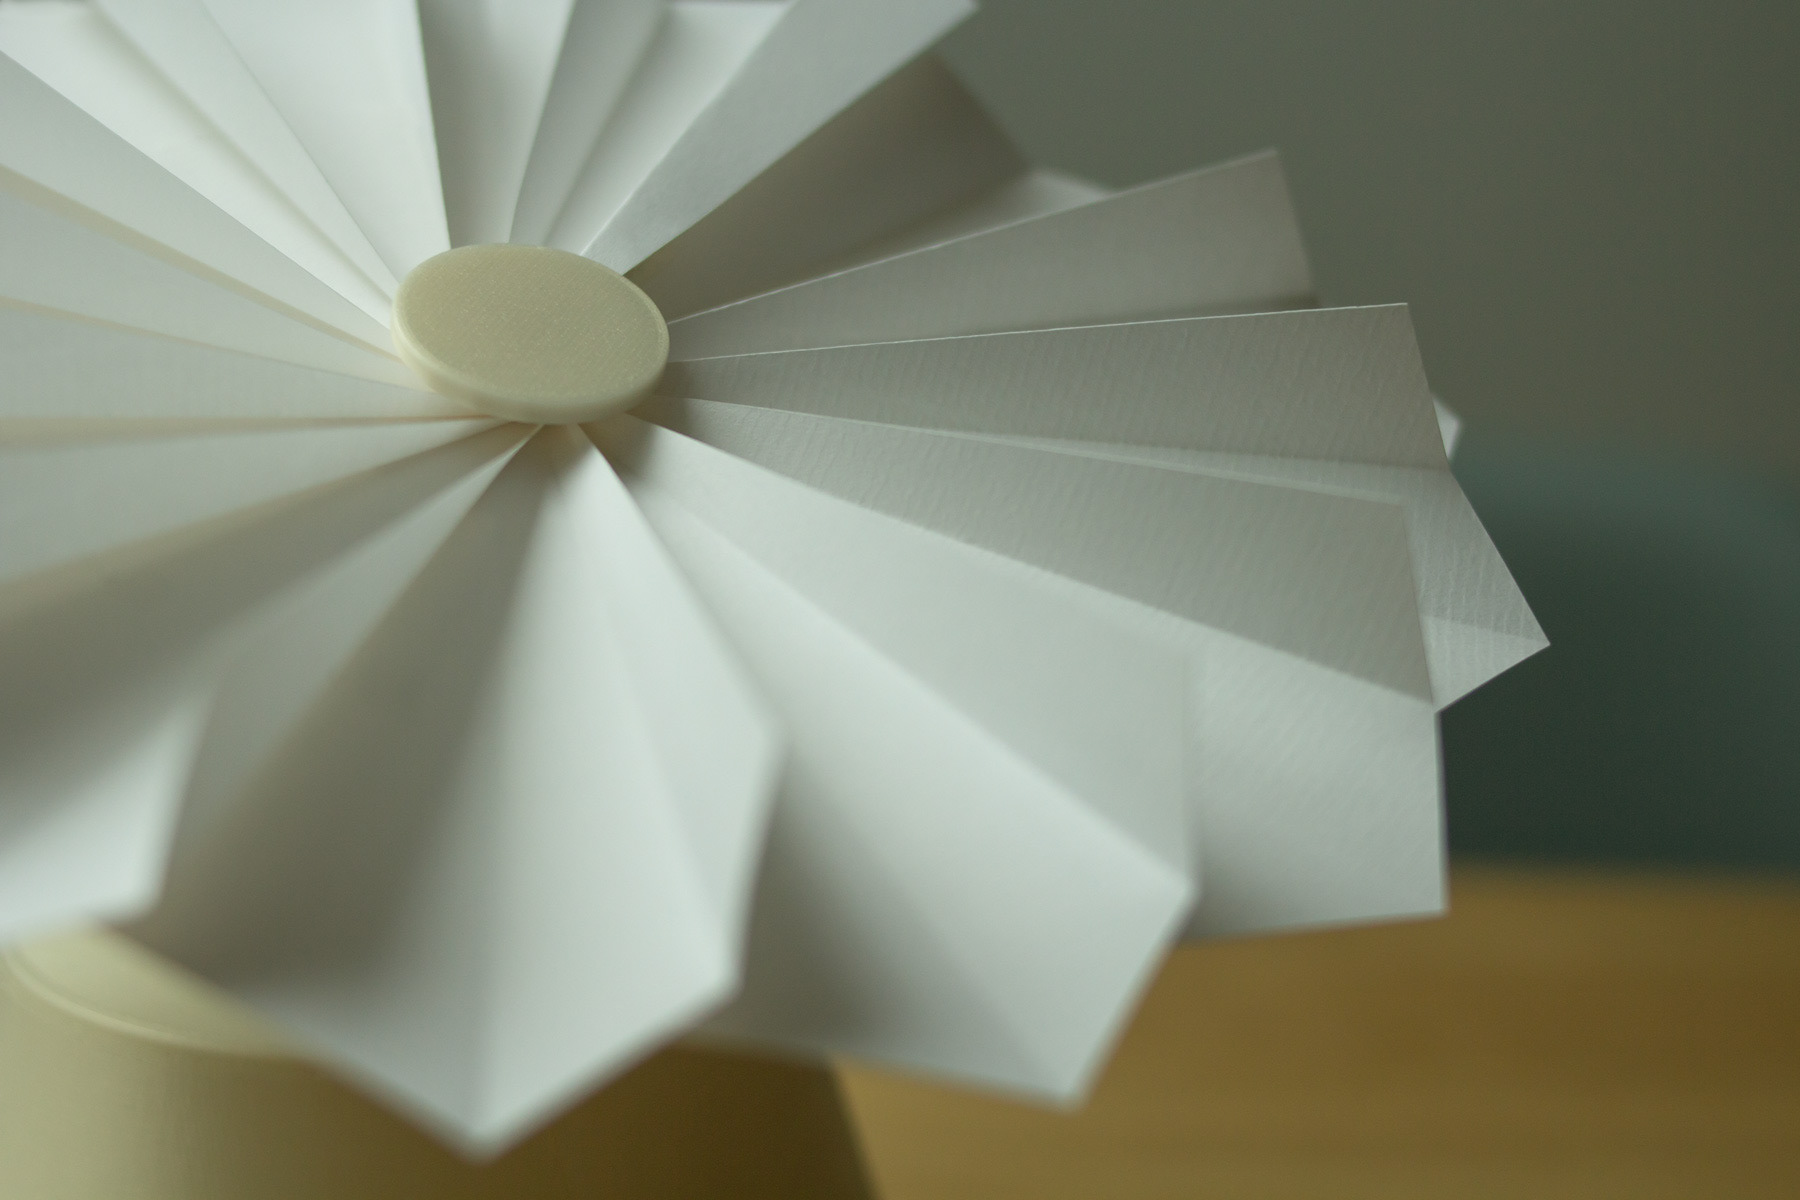
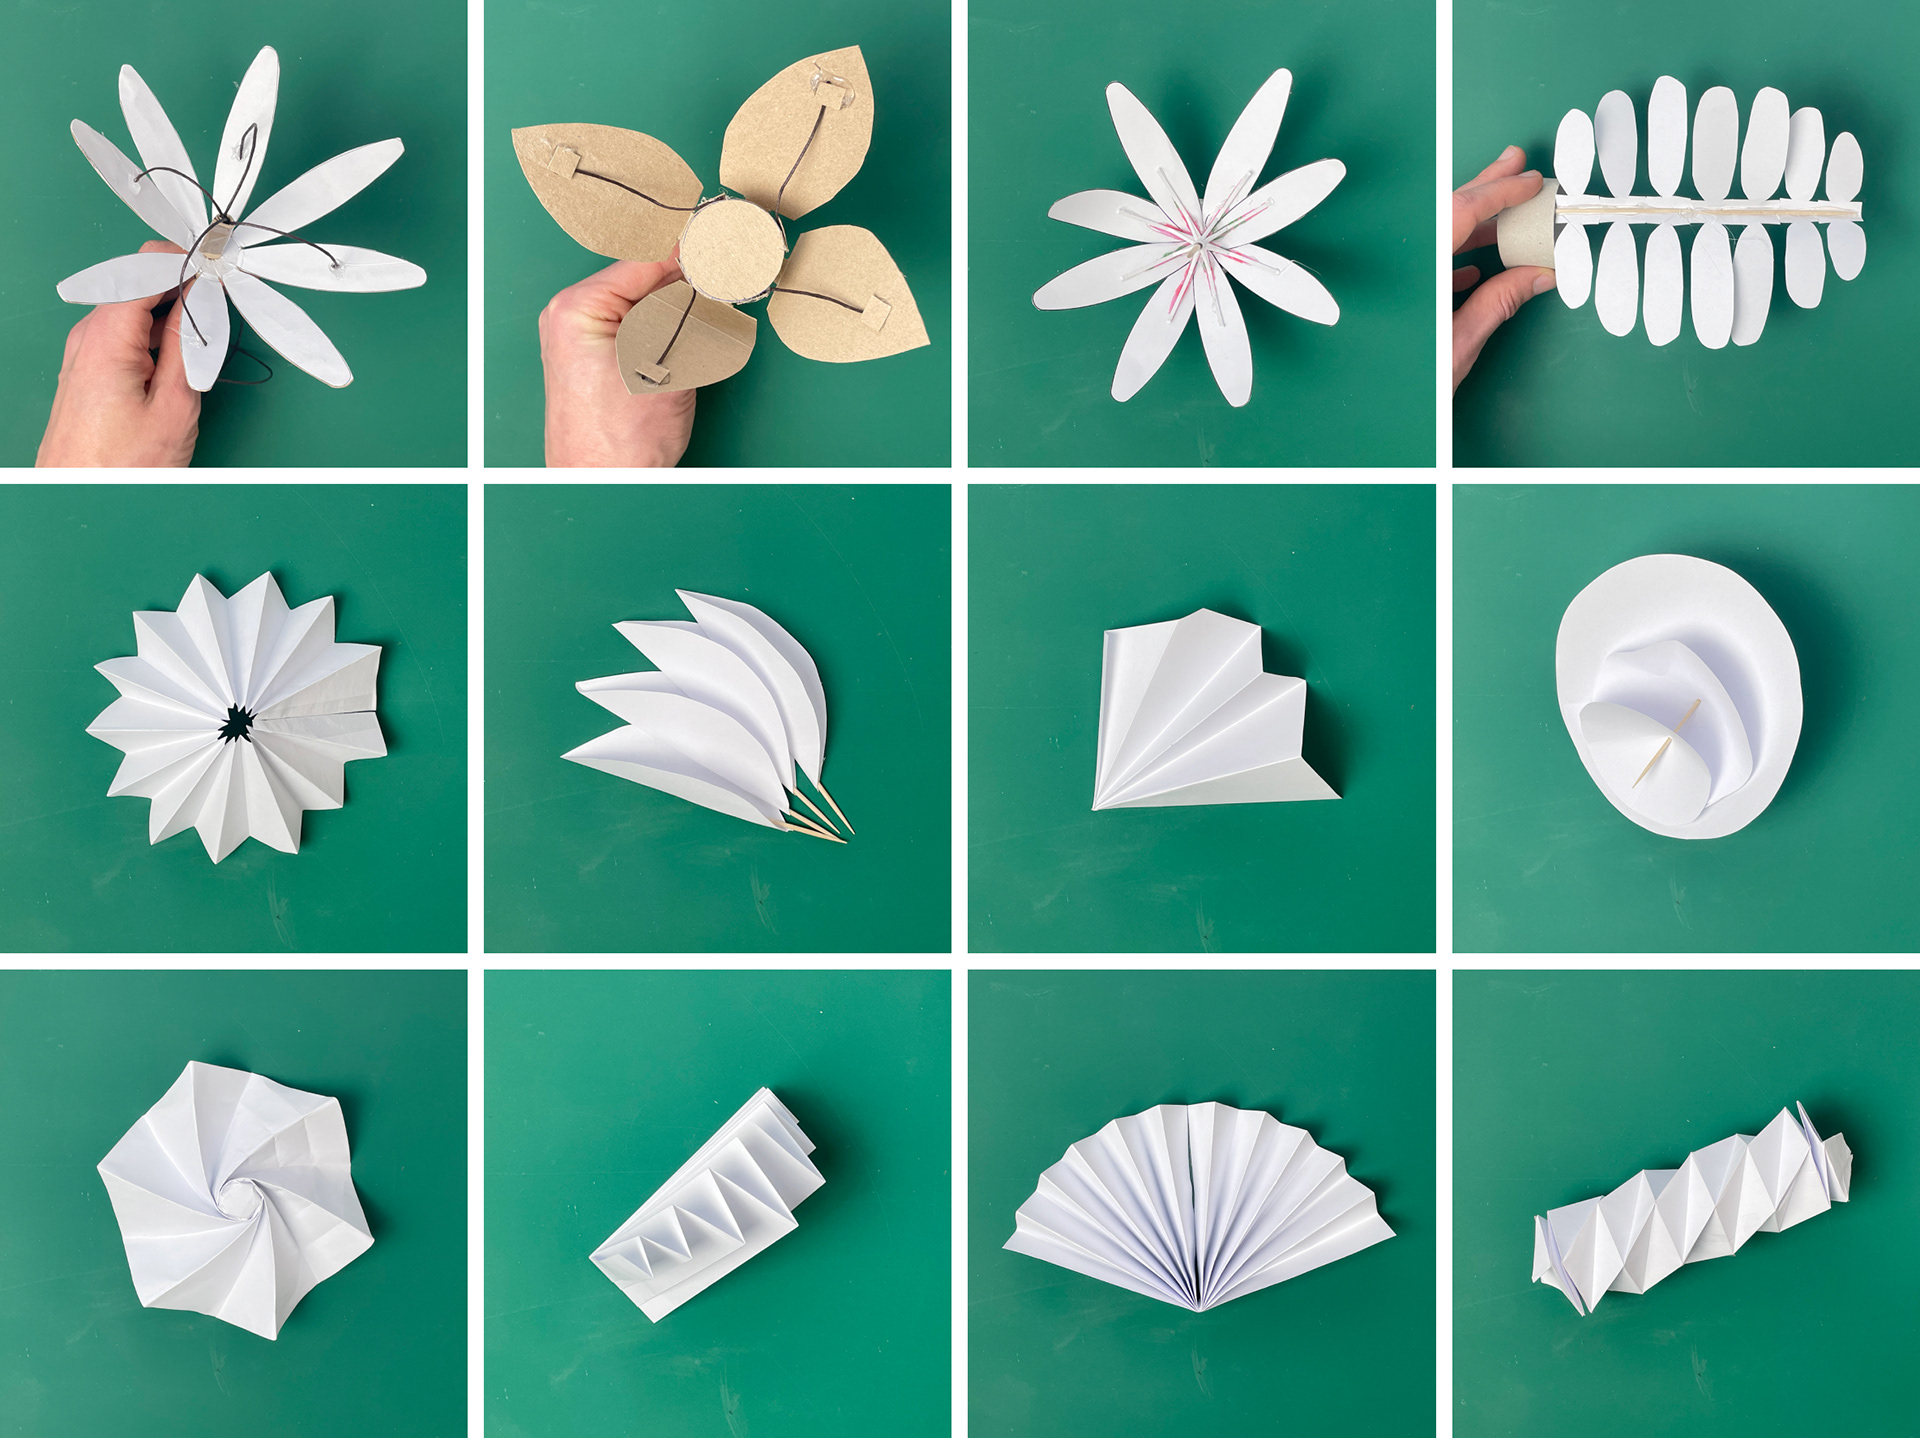
However, we realized that controlling a plant's condition involved too many parameters (water, light, temperature, position, etc.). Consequently, we decided to build our own mechanical plant to control its look and response. Therefore, I created a series of paper models to test their look and movement mechanics.
Data handling
We wanted to make the data easy to understand and actionable. Therefore, we measure the time the user's heart rate is above a certain heart rate threshold that would indicates a physical activity. That leaves the user with clear message: how much activity did I do already, and how much do I still have to do.
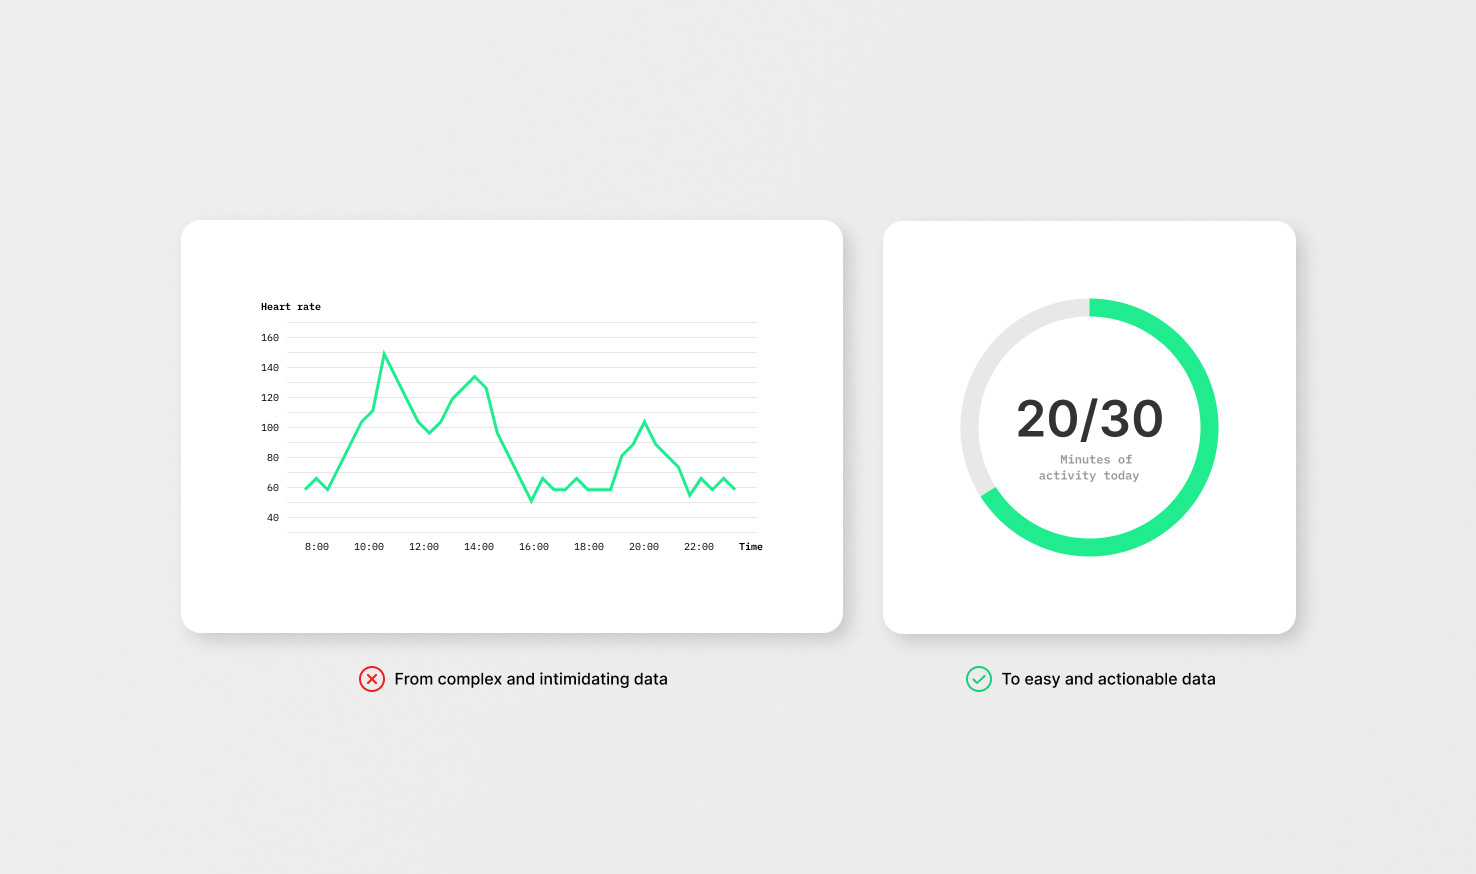
Transferring complex health data into actionable and easy information
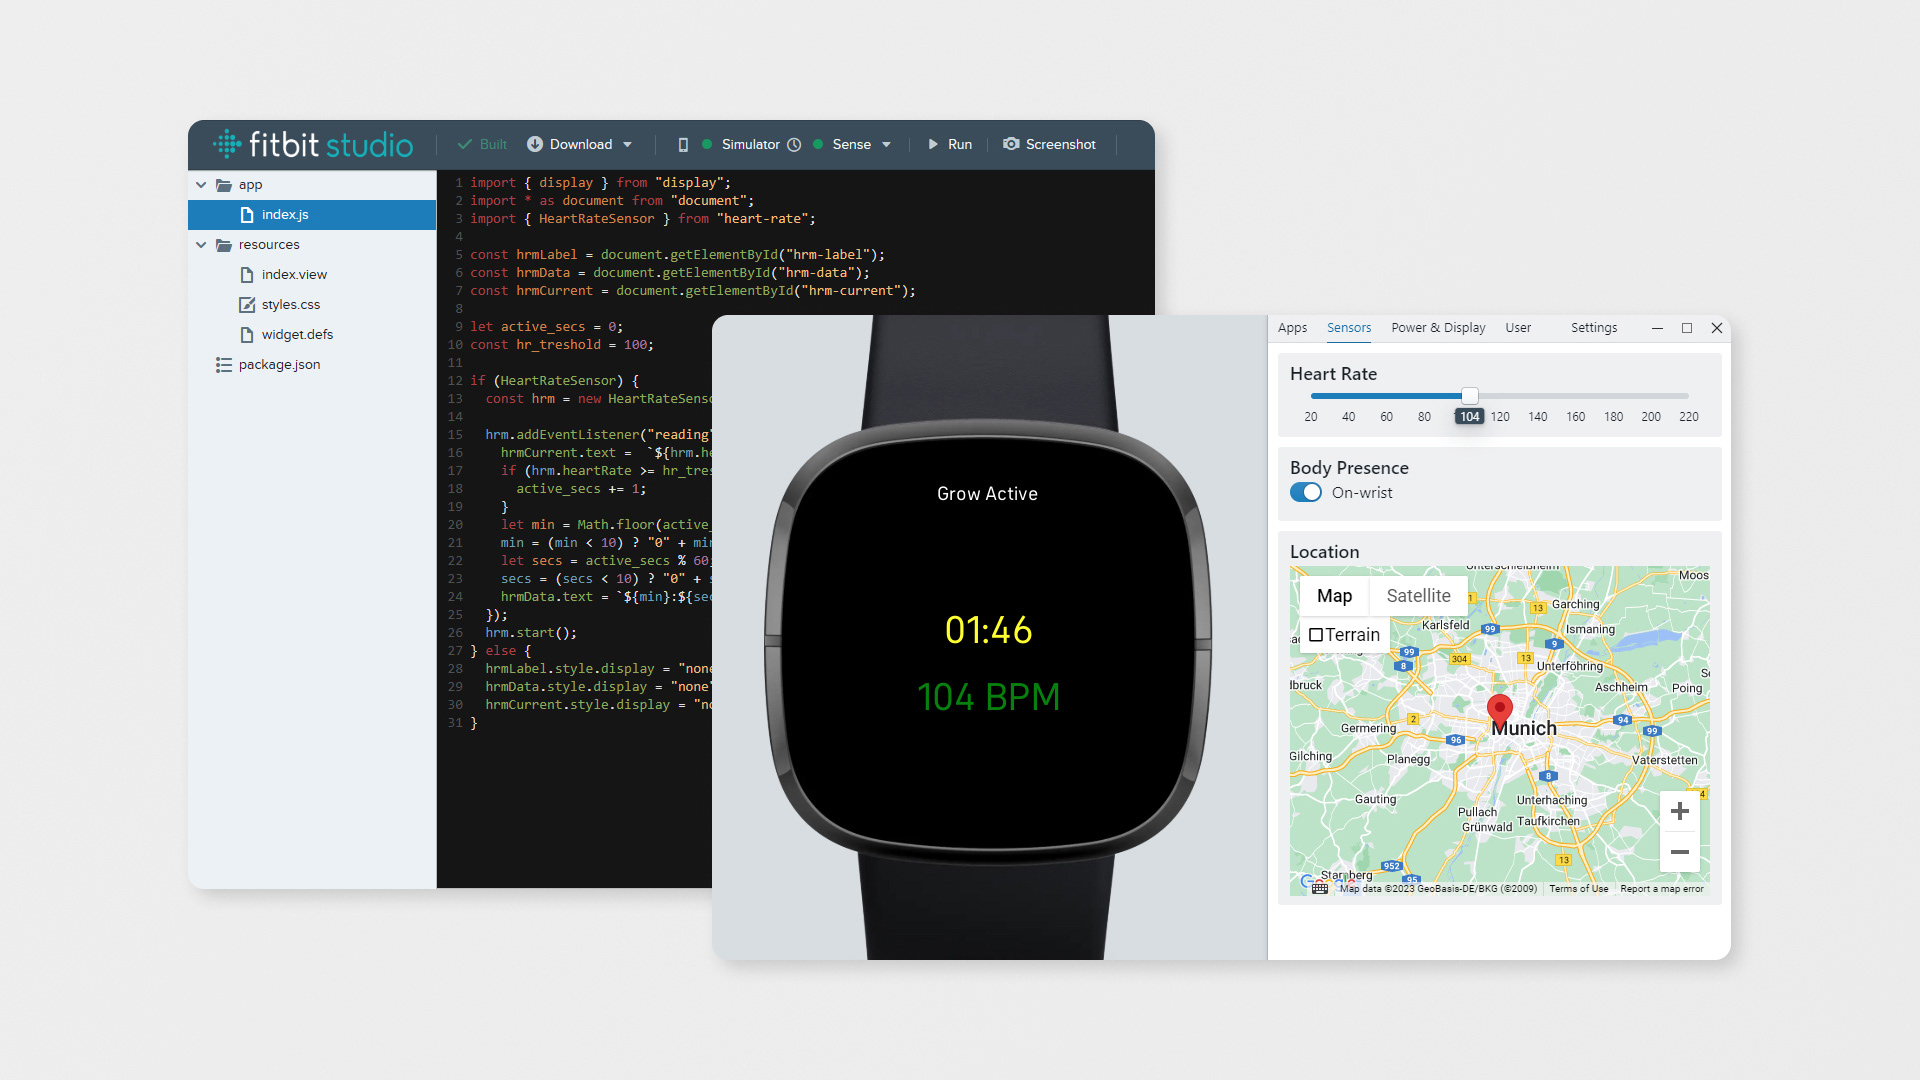
Using Fitbit Studio to experiment with real data
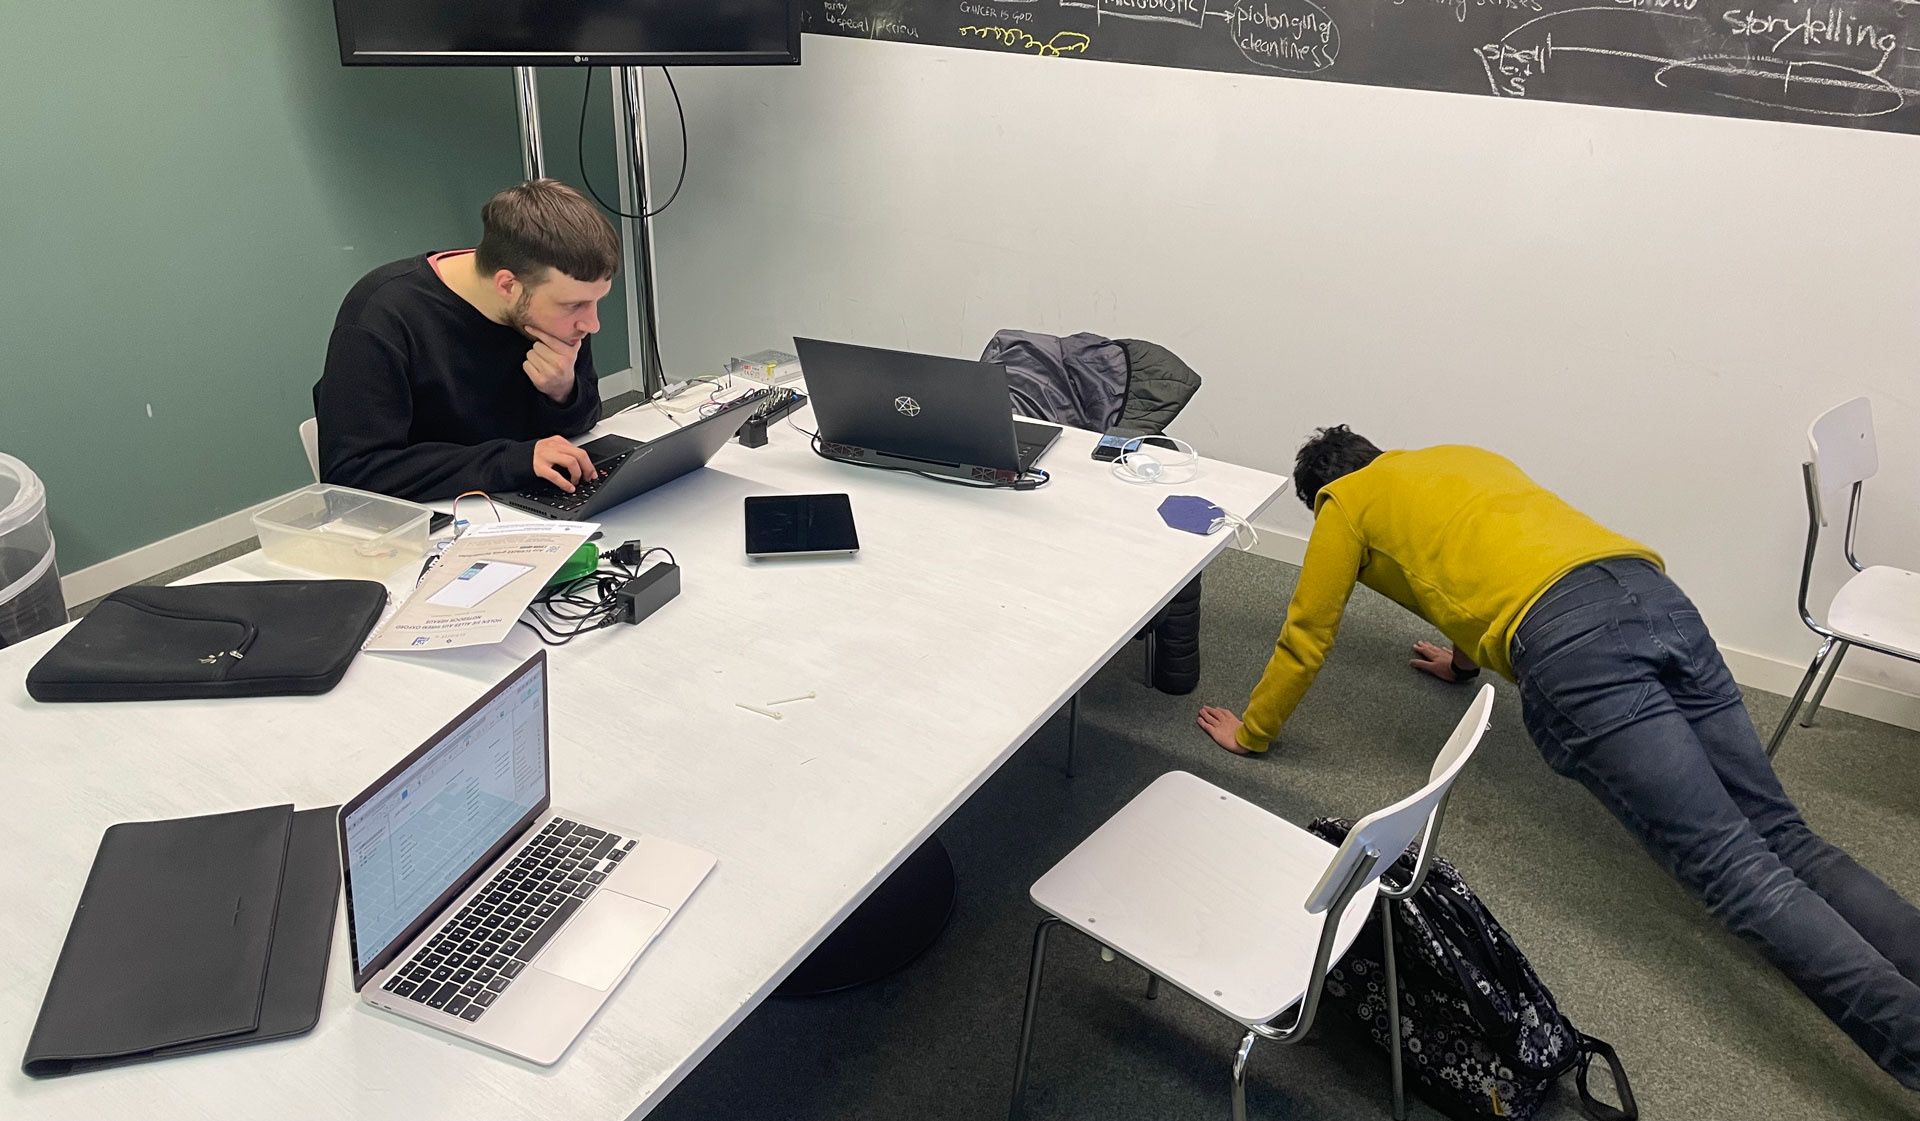
One of us always had to make push-ups when we experimented with the Fitbit smartwatch
Concept freeze
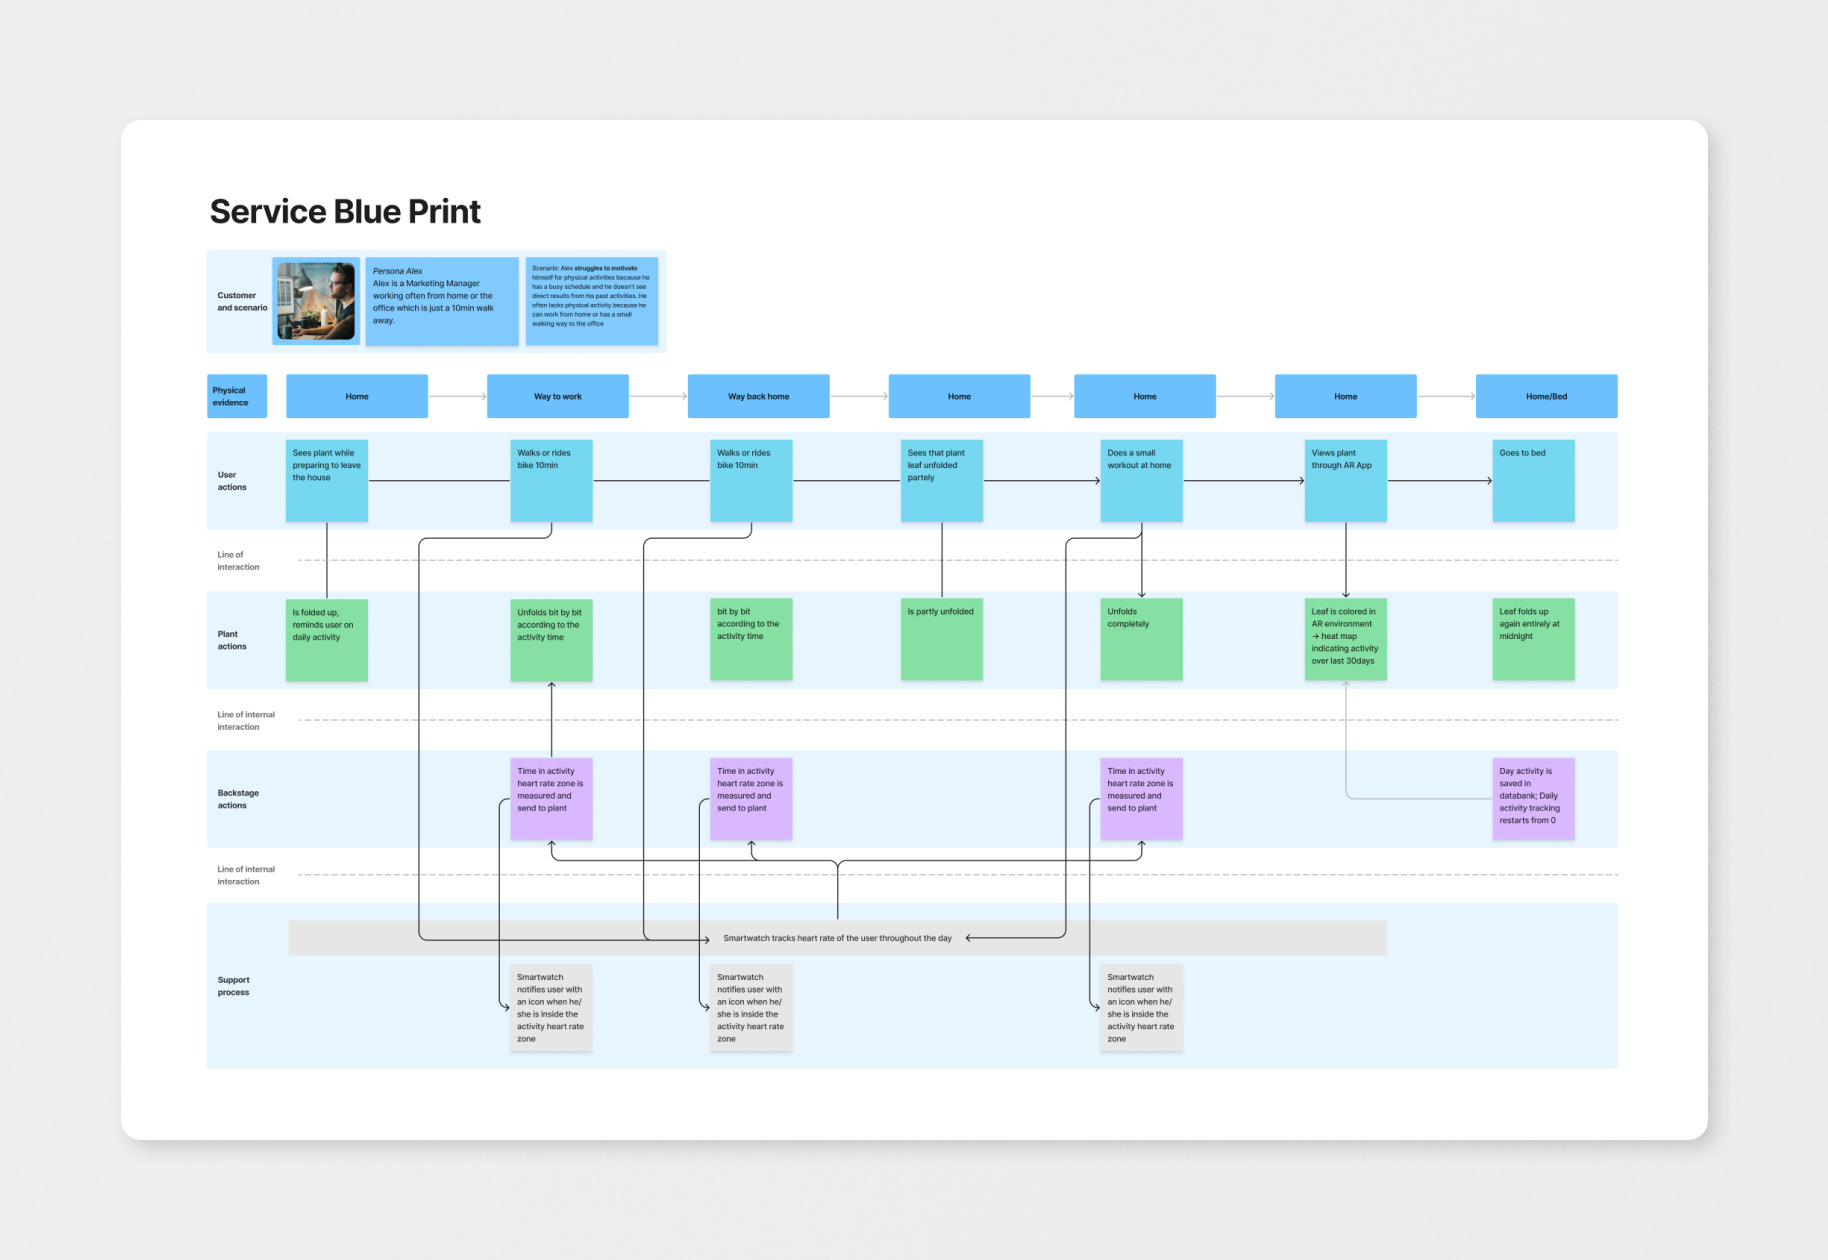
At a certain point, we decided to wrap up our concept to ensure we could implement everything in time for the exhibition. To communicate all aspects of our product, I created a Service Blueprint to illustrate all actions and connections.
Implementation
After finalizing our concept, we divided the work for the implementation. I focussed on the shape of the plant, the leaf, and the mechanics of the motion. Therefore, I designed the mechanical parts in Fusion360 and 3D-printed them with a Prusa i3 MK3S+. For the leaf, I tested different papers and techniques to assemble them. Finally, I sewed the individual blades together and threaded them onto the axle to allow optimal movement powered by one step motor.
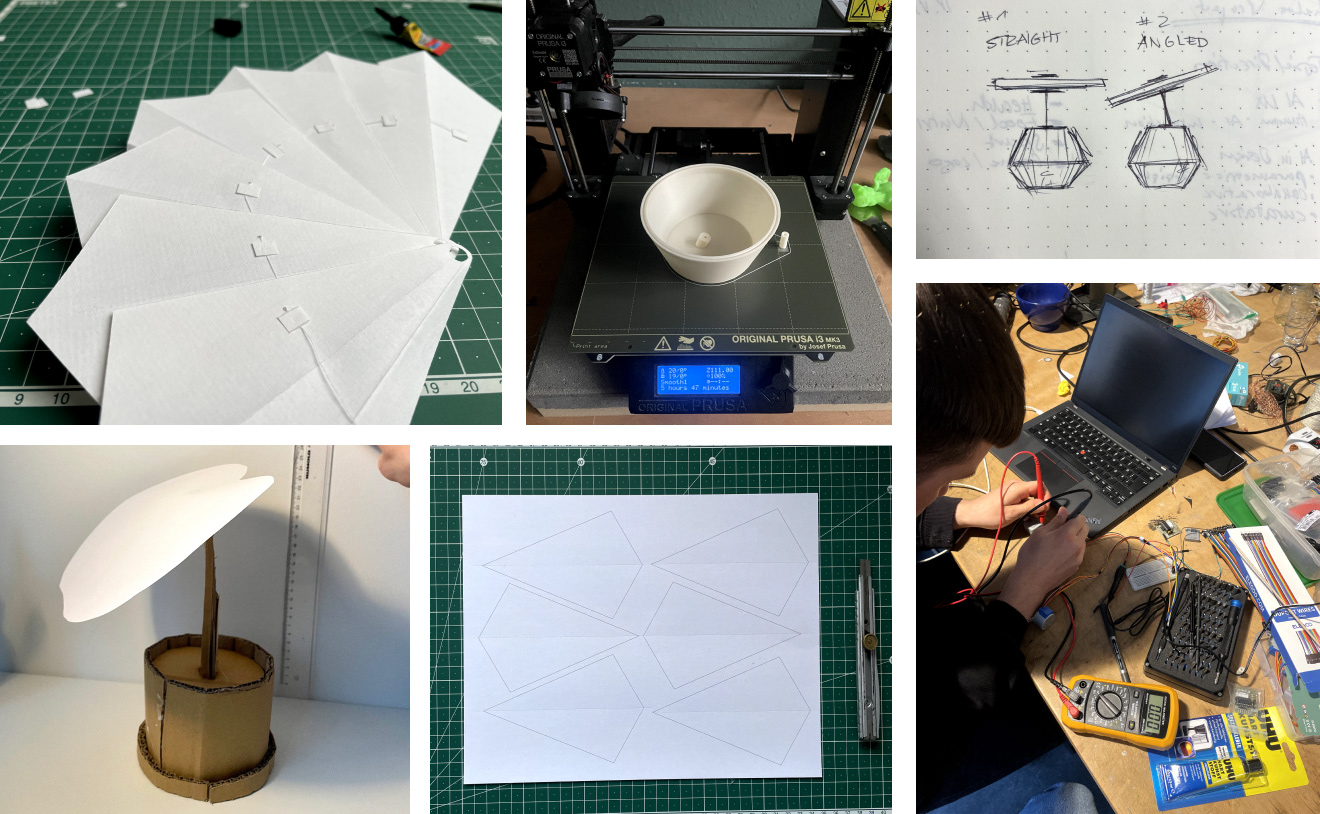
Implementation process
The mechanics of the leaf
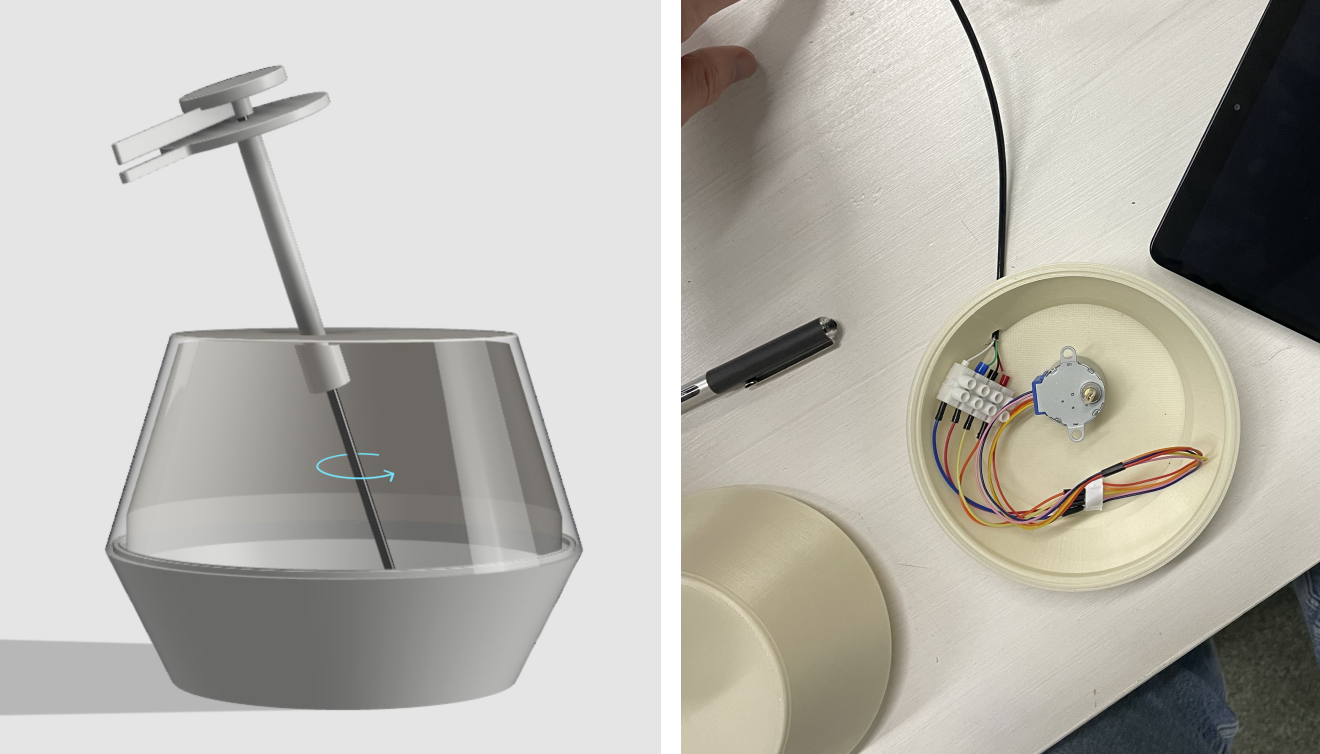
How the mechanics work
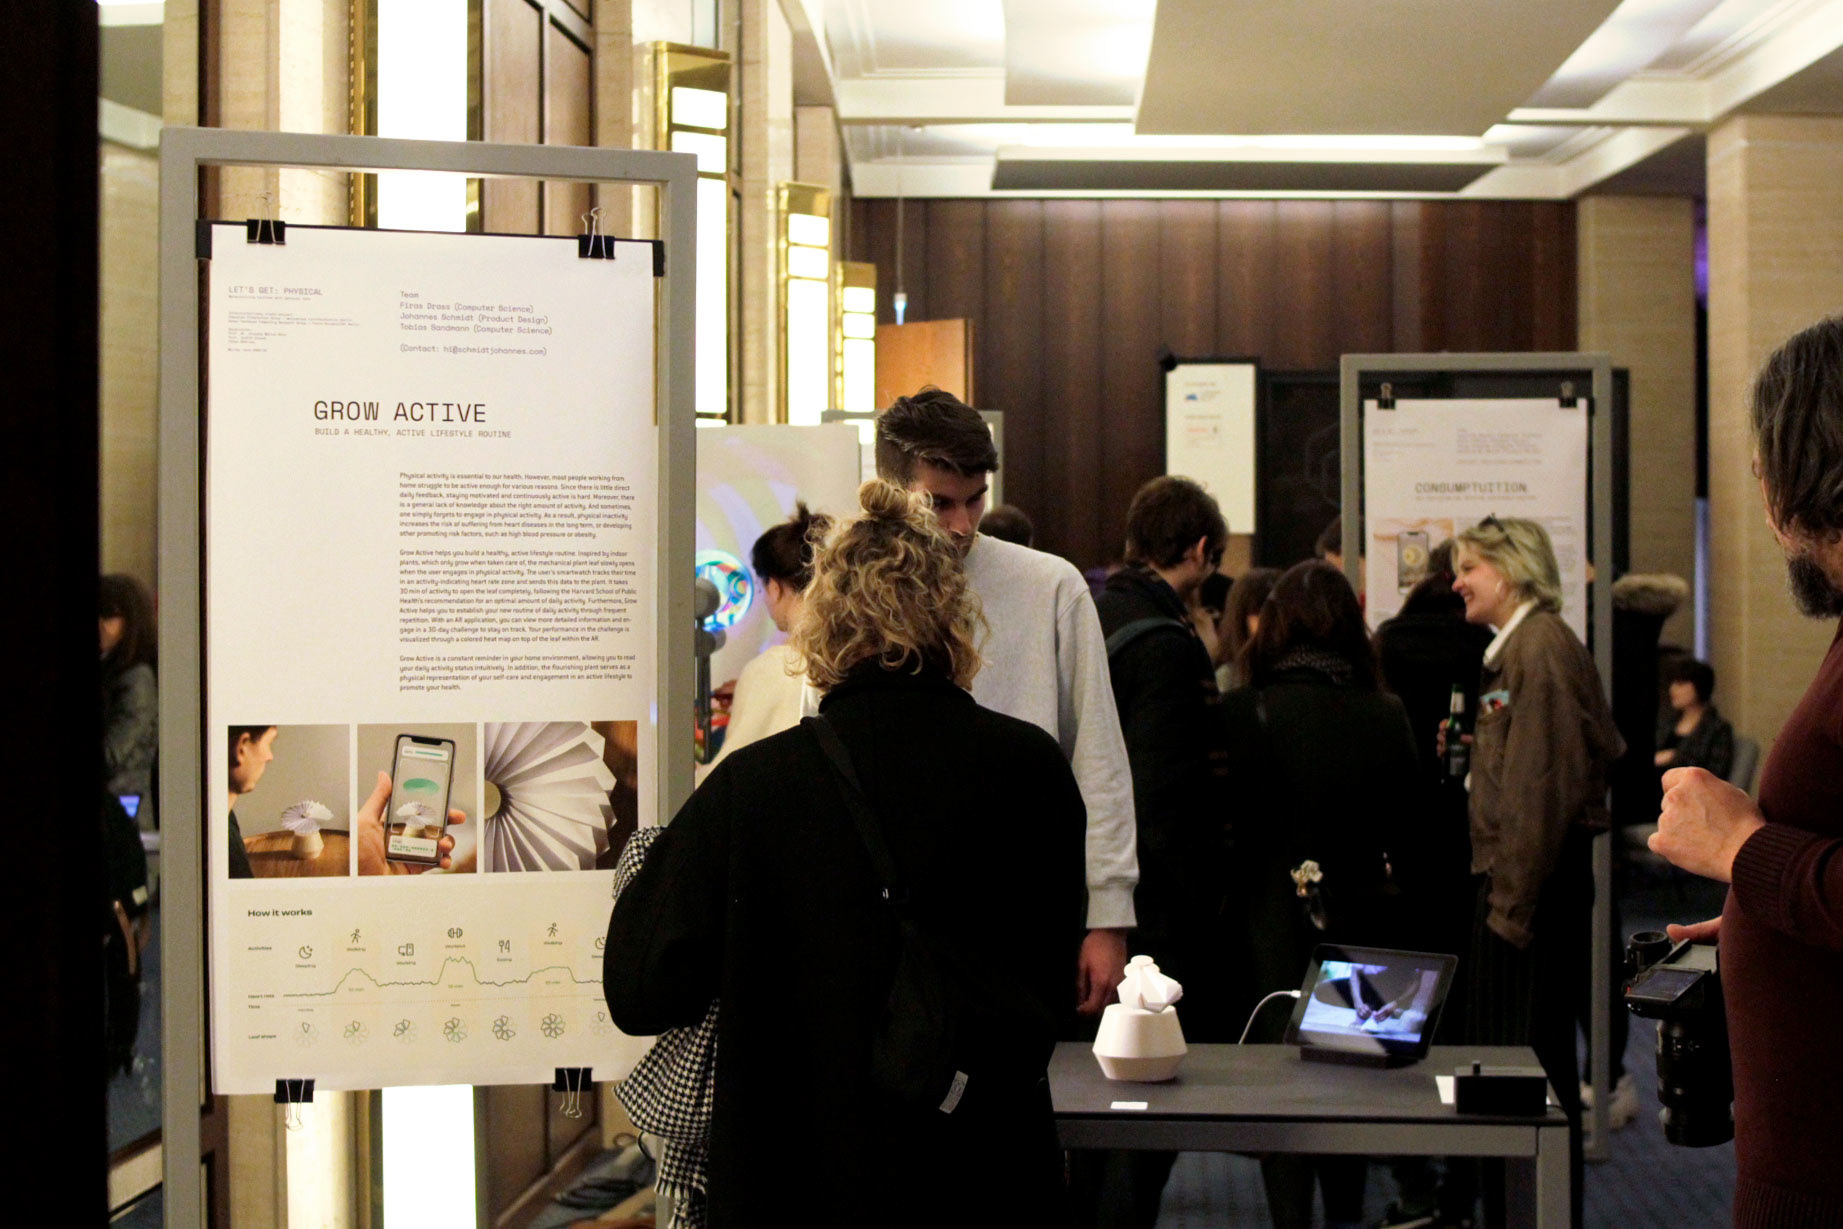
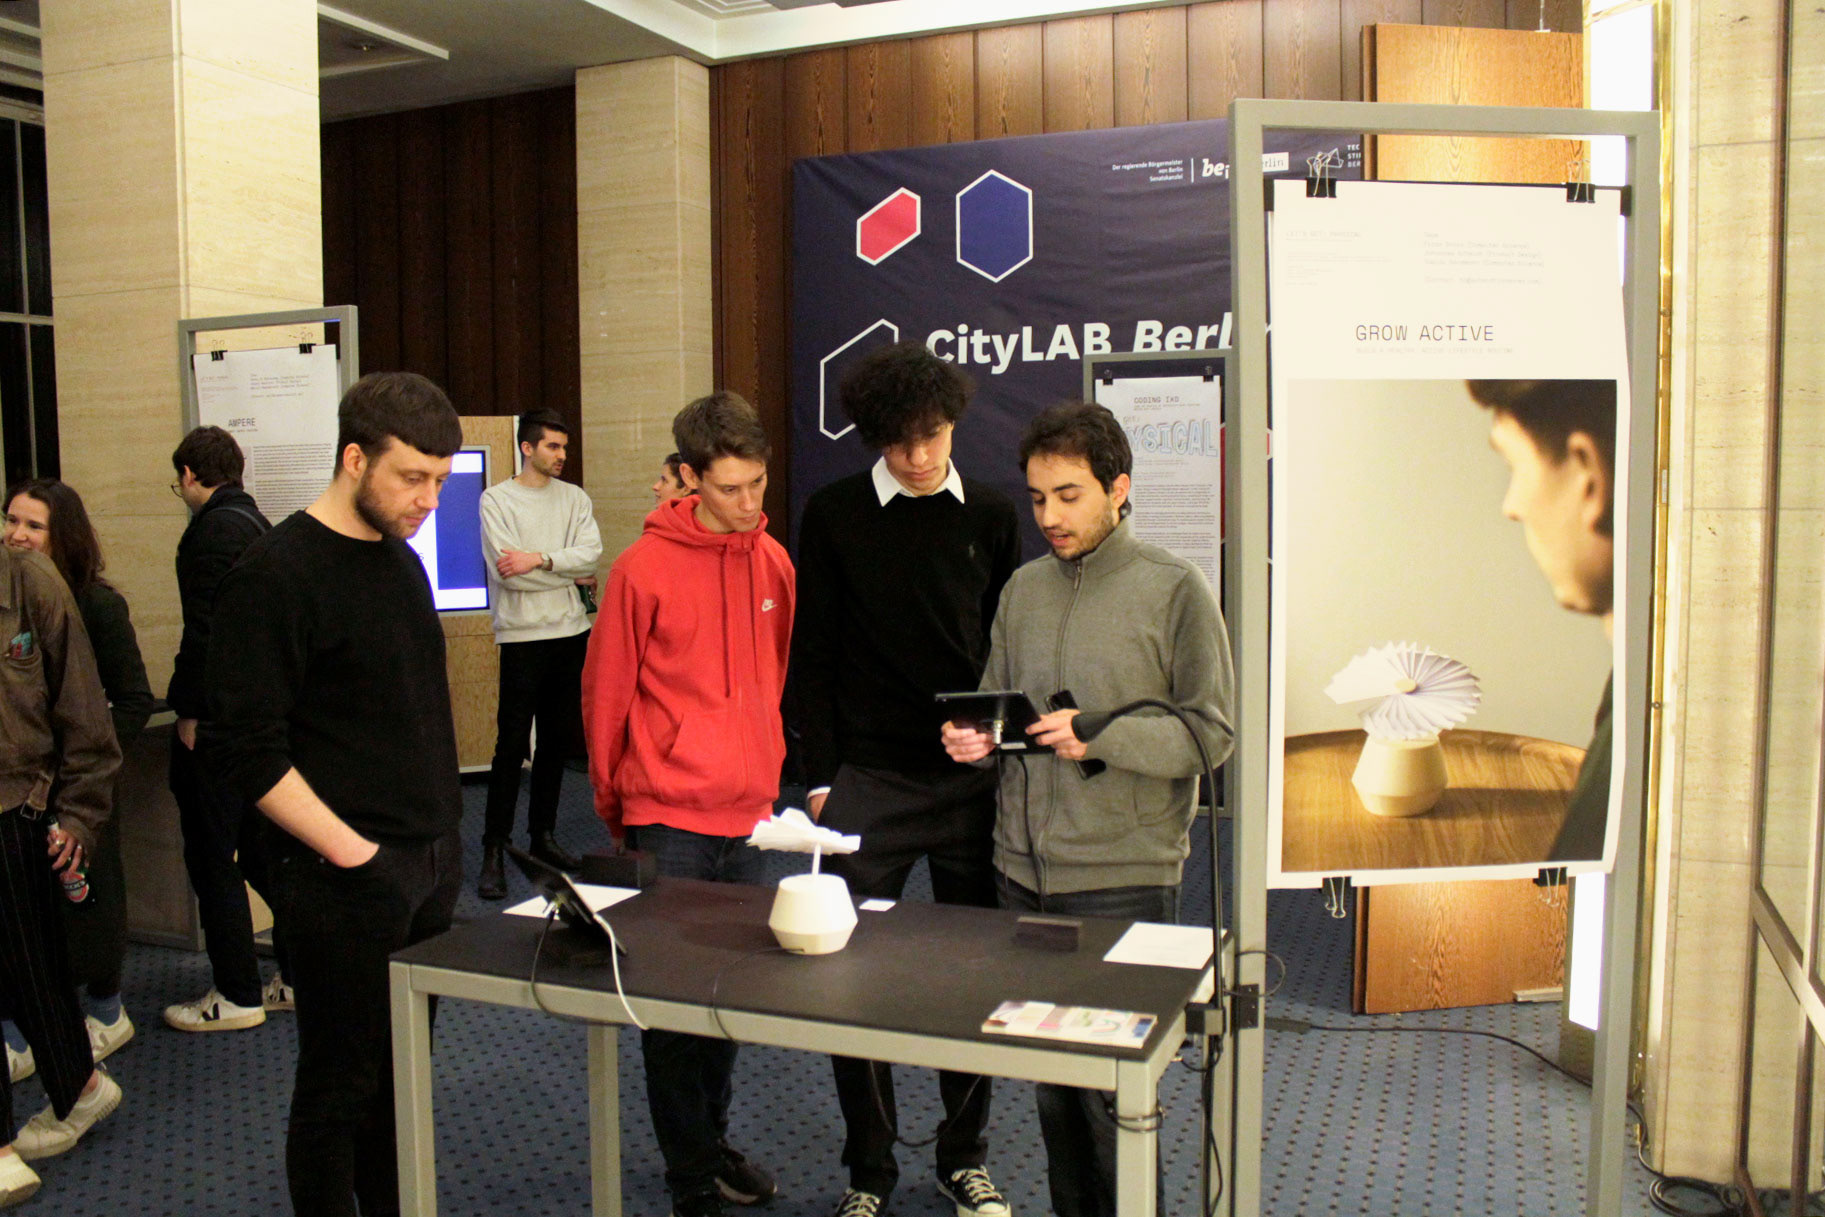
Exhibition at CityLab Berlin
From the 15th to the 23rd of February, we exhibited Grow Active at the CityLab Berlin.
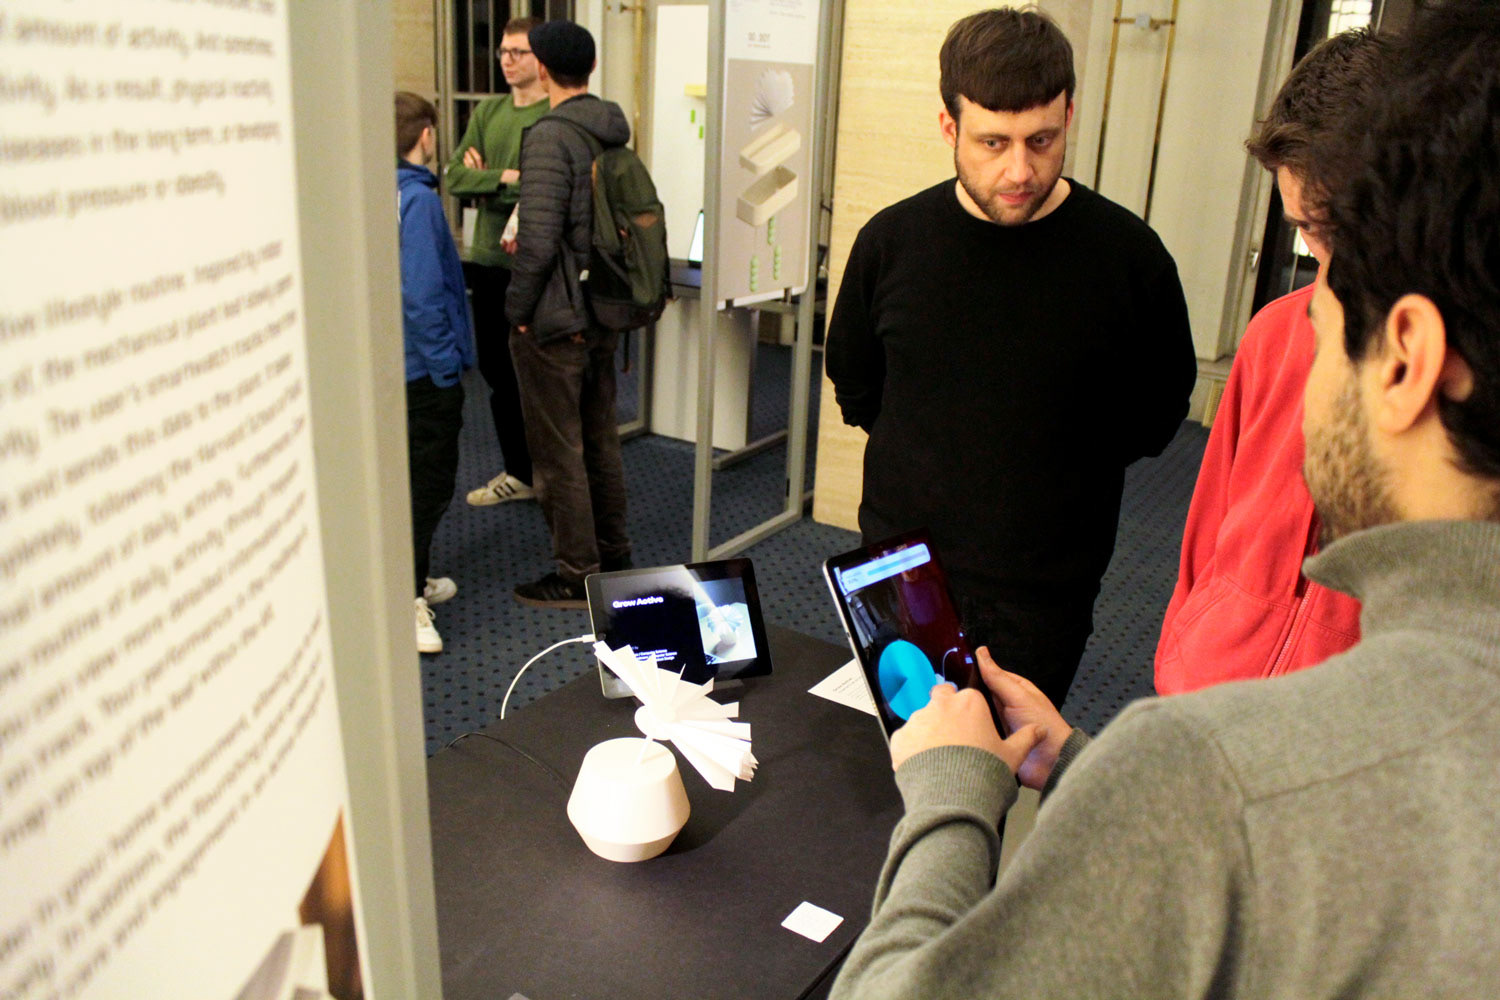
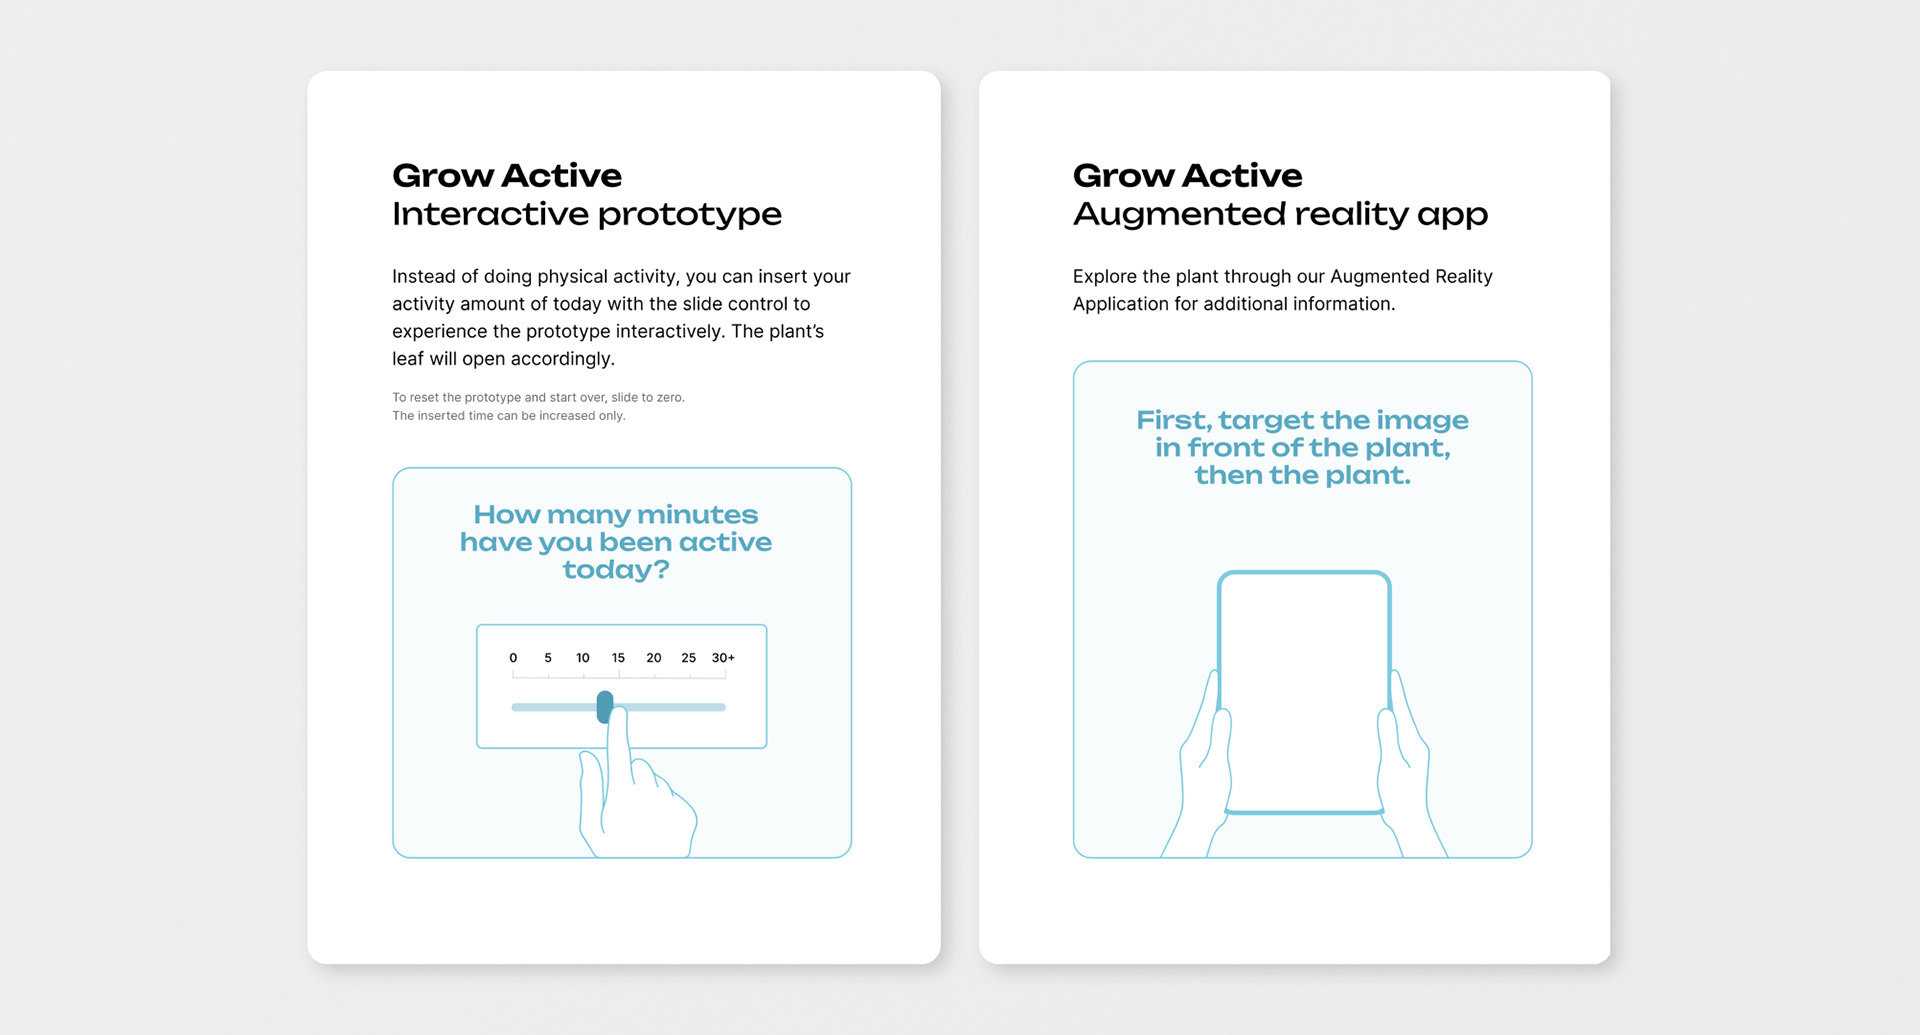
For the exhibition, we altered and accelerated the functionality of our prototype to make it interactive and easy to understand. Since the Fitbit API only provides new data once per minute, we faced a practical challenge. If we wanted to use the Fitbit smartwatch at the exhibition to try out our prototype, it would take at least one minute of exercising for the visitors to see a result; and several minutes to open the plant step by step.
This perspective seemed rather unpractical to communicate our project. Therefore, we build a manual slider that allows the visitors to insert their activity time of the day and view the plant's response. In retrospect, this approach turned out very well, and the visitors enjoyed the intuitive interaction and were able to understand the concept through it.
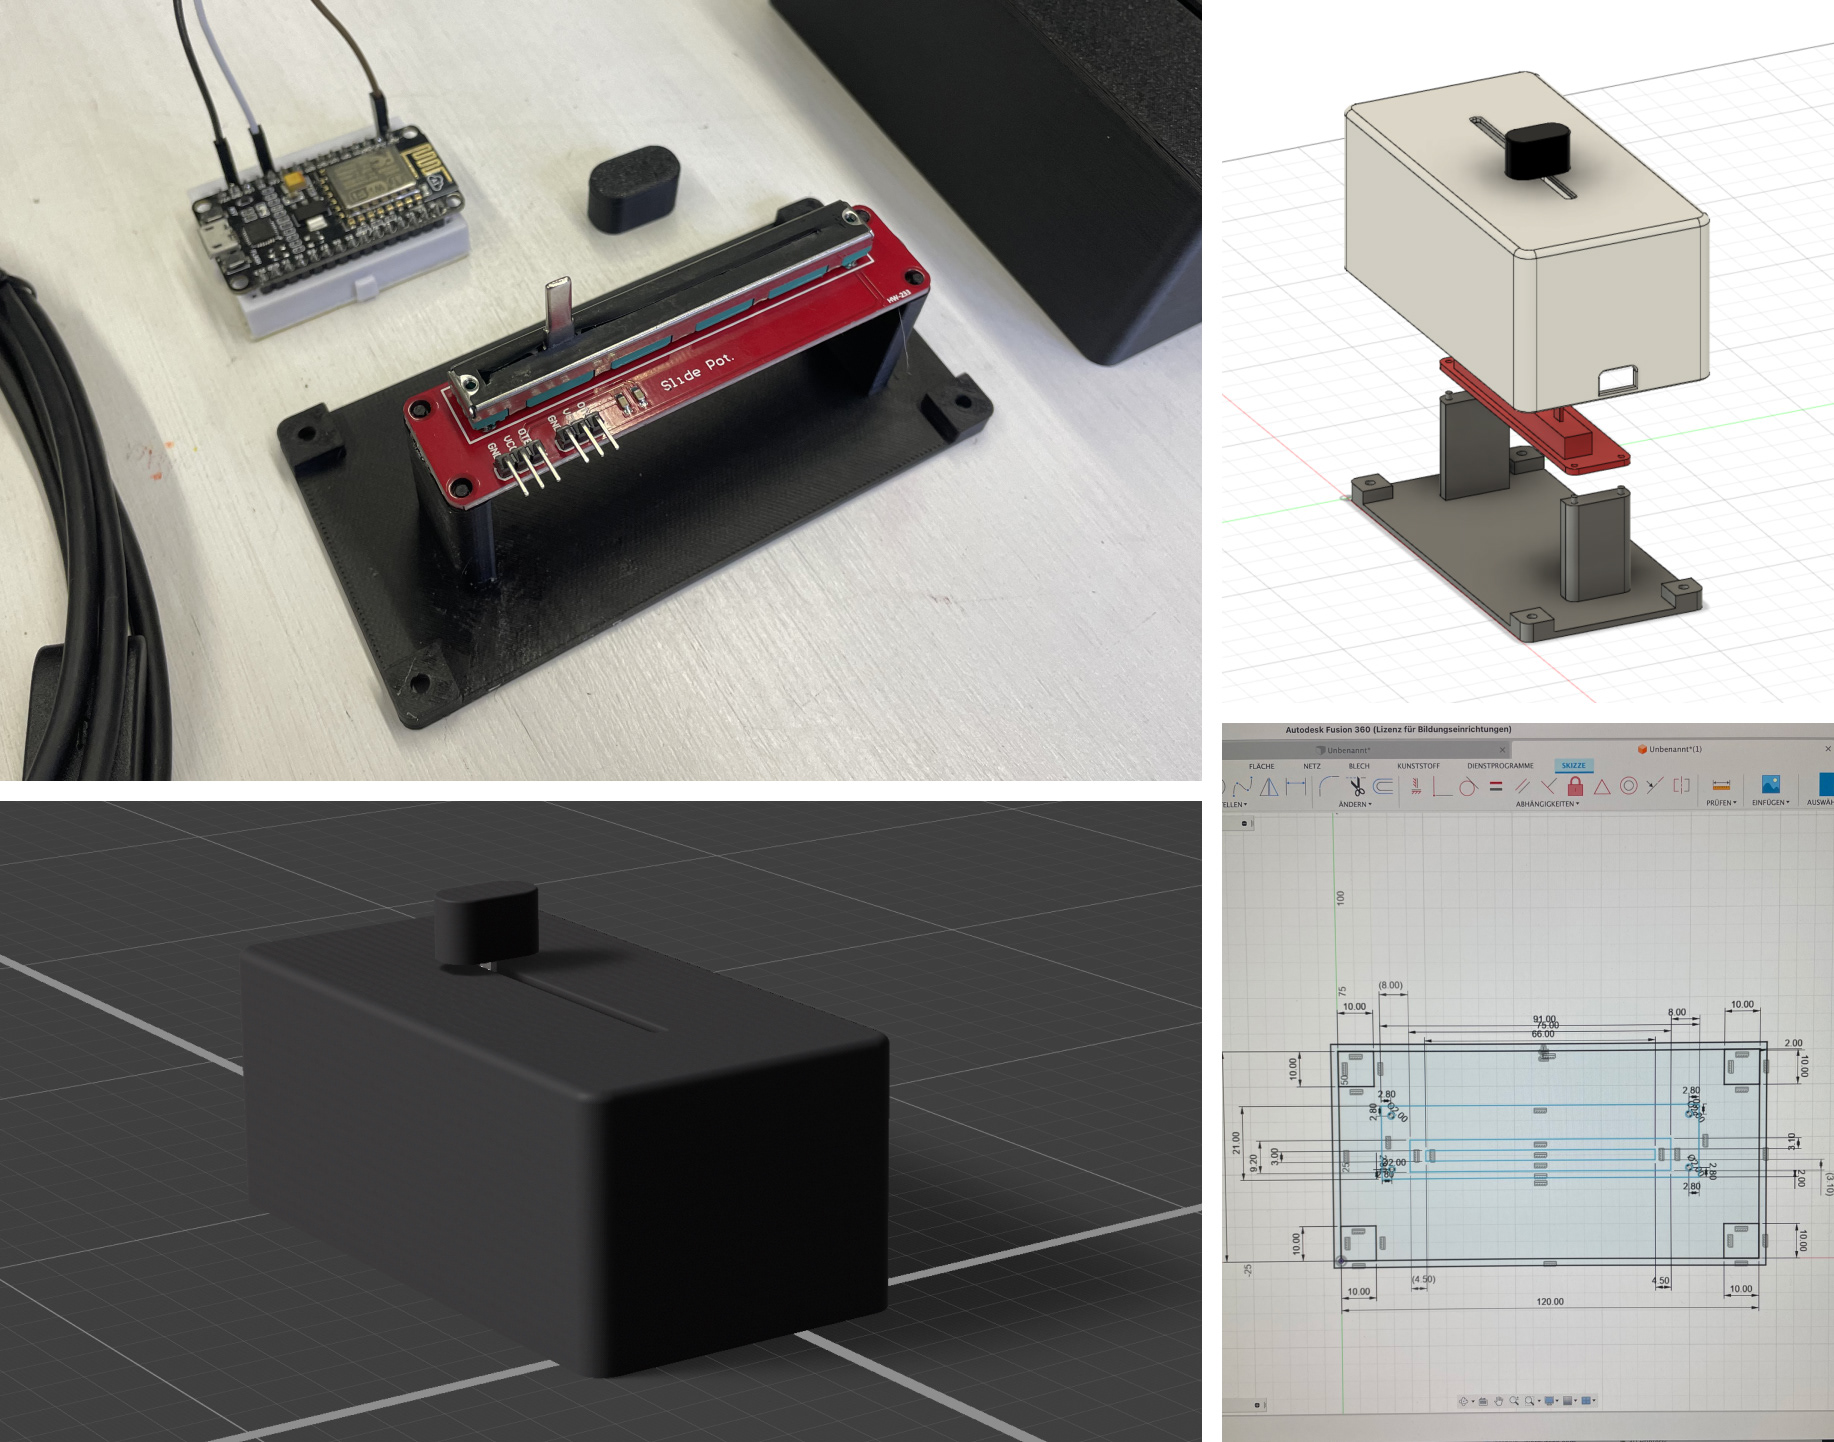
Designing and implementing the slider for the exhibition
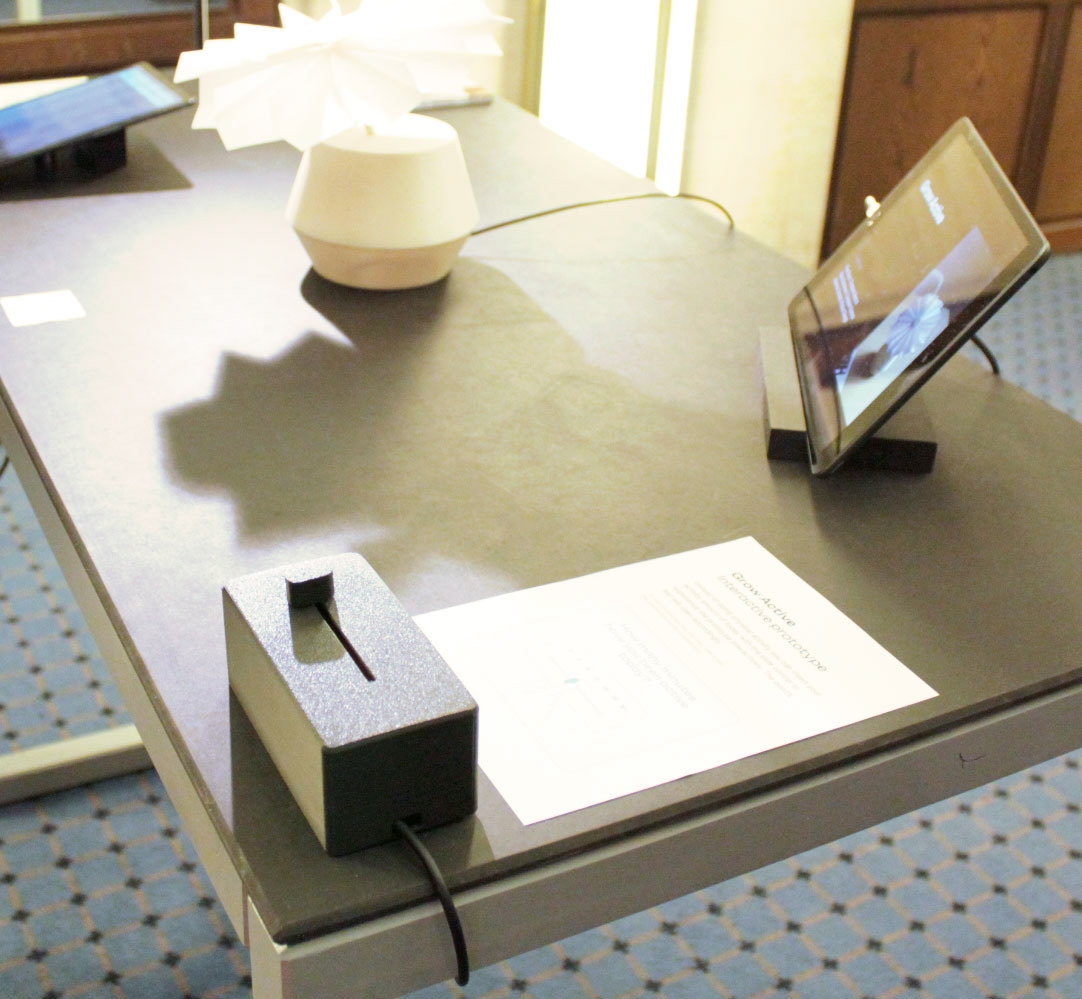
Graphics for the exhibition table
Conclusion
Working in an interdisciplinary team broadened my perspective on design and computer science. It also allowed us to deliver a fully functional prototype on a tight schedule. It was a rewarding experience to design something and receive real-world feedback in an exhibition setup. Thus, I learned how people perceive our project, which sparked many ideas for further iterations.
The project emerged from the interdisciplinary research project CodingIxD in cooperation with the Cluster of Excellence Matters of Activity and the Weißensee Academy of Art and Design Berlin.
Credits:
Tobias Sandmann & Firas Drass (Computer Science)
Tobias Sandmann & Firas Drass (Computer Science)
Supervision:
Prof. Dr. Claudia Müller-Birn (Human-Centered Computing, FU Berlin),
Prof. Judith Glaser (Product Design, KH-Berlin weißensee),
Peter Sörries (Human-Centered Computing, FU Berlin)
Prof. Dr. Claudia Müller-Birn (Human-Centered Computing, FU Berlin),
Prof. Judith Glaser (Product Design, KH-Berlin weißensee),
Peter Sörries (Human-Centered Computing, FU Berlin)